-
Food & Agriculture
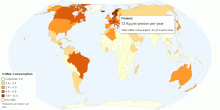
Current Worldwide Annual Coffee Consumption per capita
This map shows Coffee consumption in kilograms, consumed annually by each person in a given country or region. Current World Total Coffee Consumption: 1.3 Kilogr ...4.51 rating | 837,688 views | 26 Comments15 years ago -
Drugs & Crime
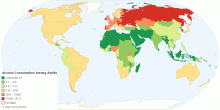
Current Worldwide Alcohol Consumption Among Adults
This chart shows alcohol consumption among adults aged ≥ 15 years in litres per person per year. Current worldwide alcohol consumption among adults: 6.13 lit ...4.47 rating | 238,566 views | 3 Comments15 years ago -
Drugs & Crime
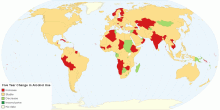
Five Year Change in Alcohol Use
This map shows five-year change (2001 - 2005) in recorded adult (15+) per capita alcohol consumption. The trend shows relatively stable global alcohol consumpti ...4.09 rating | 19,647 views | 1 Comment15 years ago -
Drugs & Crime
Current Worldwide Annual Prevalence of Cannabis amo ...
This chart shows current worldwide annual prevalence of cannabis in population aged 15-64. Number of people who used cannabis at least once in year: 142.6 - 190. ...4.28 rating | 37,786 views | 8 Comments17 years ago -
Energy
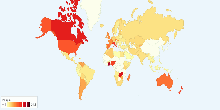
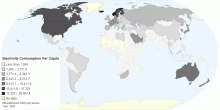
Electricity Consumption Per Capita
Electricity consumption per capita measures the average kilowatt-hours (kWh) of electrical power generated per person in a particular country or region. Note: E ...4.20 rating | 51,694 views | Discuss this15 years ago -
Energy
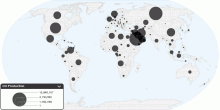
Current Worldwide Oil Production
This chart shows current oil production in the world. Current Oil Production in the World: 81,820,404.59 barrels per day (bbl/day) 1 barrel = (42 US gallons, 158 ...4.04 rating | 65,897 views | 13 Comments16 years ago -
Drugs & Crime
Current Worldwide Annual Prevalence of Amphetamines ...
This chart shows current worldwide annual prevalence of amphetamine-type stimulants (excluding ecstasy) in population aged 15-64. Number of people who used Amphe ...3.74 rating | 15,220 views | Discuss this17 years ago -
Energy
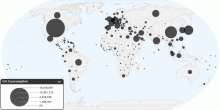
Current Worldwide Oil Consumption
This chart shows current oil consumption in the world. Current Oil Consumption in the World: 84,455,330 barrels per day (bbl/day) 1 barrel = (42 US gallons, 158. ...3.96 rating | 47,692 views | 42 Comments16 years ago -
Energy
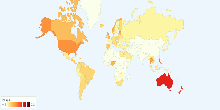
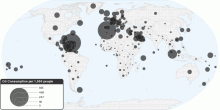
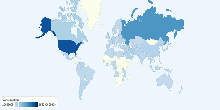
Current Worldwide Oil Consumption per 1000 people
This chart shows current oil consumption (per capita) in the world. Current Oil Consumption in the World: 31.1 barrels per day (bbl/day) per 1,000 people 1 b ...3.48 rating | 29,447 views | Discuss this16 years ago -
Food & Agriculture
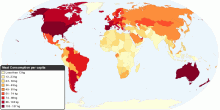
Current Worldwide Annual Meat Consumption per capita
This map shows current worldwide annual Meat Consumption per capita. World average meat consumption: 46.6 kg per person per year4.69 rating | 181,335 views | 25 Comments16 years ago -
Food & Agriculture
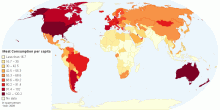
Current Worldwide Annual Meat Consumption per capita
This map shows current worldwide annual Meat Consumption per capita. World average meat consumption: 41.90 kg per person per year4.54 rating | 735,233 views | 46 Comments13 years ago -
Drugs & Crime
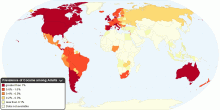
Current Worldwide Annual Prevalence of Cocaine among Adults
This chart shows current worldwide annual prevalence of cocaine in population aged 15-64. Number of people who used cocaine at least once in year: 15 - 19.3 mil ...4.36 rating | 85,945 views | 3 Comments16 years ago -
Drugs & Crime
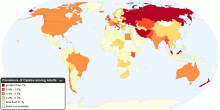
Current Worldwide Annual Prevalence of Opiates among Adults
This chart shows current worldwide annual prevalence of opiates in population aged 15-64. Number of people who used opiates at least once in year: 12.8 - 21.9 m ...4.56 rating | 46,991 views | 2 Comments16 years ago -
Energy
Current Worldwide Natural Gas Consumption per capita
This chart shows current Natural Gas Consumption in the world. Current Natural Gas Consumption in the World: 444.1 cubic meters (m³) per capita4.15 rating | 13,756 views | Discuss this17 years ago -
Energy
Current Worldwide Natural Gas Consumption
This chart shows current Natural Gas Consumption in the world. Current Natural Gas Consumption in the World: 3,015,443,467,227 cubic meters (m³)4.03 rating | 13,952 views | 4 Comments17 years ago