-
Energy
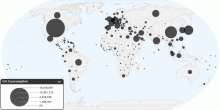
Current Worldwide Oil Consumption
This chart shows current oil consumption in the world. Current Oil Consumption in the World: 84,455,330 barrels per day (bbl/day) 1 barrel = (42 US gallons, 158. ...3.96 rating | 47,692 views | 42 Comments16 years ago -
Energy
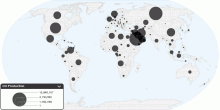
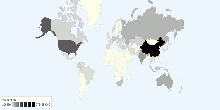
Current Worldwide Oil Production
This chart shows current oil production in the world. Current Oil Production in the World: 81,820,404.59 barrels per day (bbl/day) 1 barrel = (42 US gallons, 158 ...4.04 rating | 65,897 views | 13 Comments16 years ago -
Food & Agriculture
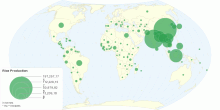
Worldwide Rice Production
This map shows global rice production. Worldwide Rice Production : 678,688,289 tonnes Worldwide Rice Area Harvested : 161,420,743 Ha World production of rice ...4.19 rating | 65,351 views | 6 Comments15 years ago -
Energy
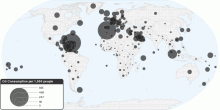
Current Worldwide Oil Consumption per 1000 people
This chart shows current oil consumption (per capita) in the world. Current Oil Consumption in the World: 31.1 barrels per day (bbl/day) per 1,000 people 1 b ...3.48 rating | 29,447 views | Discuss this16 years ago -
Energy
Current Worldwide Natural Gas Production
This chart shows current Natural Gas Production in the world. Current Natural Gas Production in the World: 3,065,690,558,538 cubic meters (cu m)3.86 rating | 20,179 views | Discuss this17 years ago -
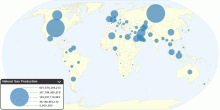
Food & Agriculture
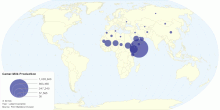
Current Worldwide Cow Milk Production
This map shows current worldwide Cow milk (whole, fresh) production. World Total Cow Milk Production: 585,234,624 tonnes per year4.59 rating | 31,585 views | Discuss this15 years ago -
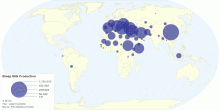
Food & Agriculture
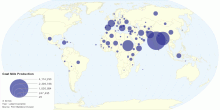
Current Worldwide Sheep Milk Production
This map shows current worldwide Sheep milk (whole, fresh) production. World Total Sheep Milk Production: 9,272,693 tonnes per year4.12 rating | 23,731 views | 2 Comments15 years ago -
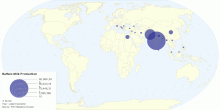
Food & Agriculture
Current Worldwide Buffalo Milk Production
This map shows current worldwide Buffalo Milk (whole, fresh) production. World Total Buffalo Milk production: 92,140,146 tonnes per year4.20 rating | 24,512 views | 1 Comment15 years ago -
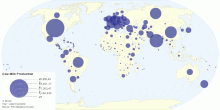
Food & Agriculture
Current Worldwide Camel Milk Production
This map shows current worldwide Camel milk (whole, fresh) production. World Total Camel Milk Production: 1,840,201 tonnes per year4.50 rating | 18,257 views | 1 Comment15 years ago -
Economic
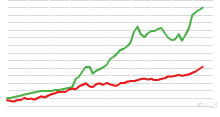
World Bicycle and Automobile Production, 1950 to Present
This chart shows World Bicycle and Automobile Production, 1950 to 2007. Note: Bicycle data include electric bicycles. 2003 bicycle data considered underestimate ...4.76 rating | 54,193 views | Discuss this16 years ago -
Food & Agriculture
Current Worldwide Goat Milk Production
This map shows current worldwide Goat Milk (whole, fresh) production. World Total Goat Milk Production: 15,510,411 tonnes per year4.63 rating | 29,557 views | Discuss this15 years ago -
Food & Agriculture
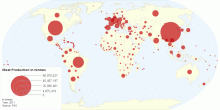
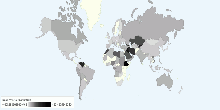
Current Worldwide Annual Meat Production in tonnes ...
This map shows current worldwide annual Meat Production in tonnes per country. World average meat production: 727,052,012 tonnes per year.4.56 rating | 23,478 views | Discuss this13 years ago -
Energy
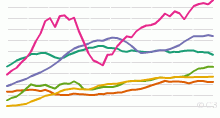
Historical Oil Production by Region, 1965 to Present
This chart shows the historical Oil Production - 1965 onwards. List of countries included in each region: North America includes United States,Canada and Me ...4.41 rating | 45,658 views | 5 Comments17 years ago -
Energy
Current Worldwide Reserves-to-production ratio of Oil
This chart shows the Current World Reserves-to-production ratio of Oil. Current World Reserves-to-production ratio of Oil: 42.11 Years What Does Reserves to Pr ...4.12 rating | 26,605 views | 1 Comment17 years ago -
Energy
Current Worldwide Coal Production
This chart shows current Coal Production in the world. Current Coal Production in the World: 6,781,173,808 tonnes3.74 rating | 14,669 views | Discuss this17 years ago