-
Drugs & Crime
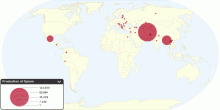
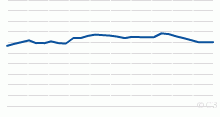
Current Worldwide Illicit Cultivation of Opium Popp ...
This chart shows current worldwide illicit cultivation of opium poppy and production of opium. Total area under opium poppy cultivation in the major culti ...4.19 rating | 185,608 views | Discuss this16 years ago -
Food & Agriculture
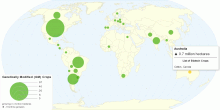
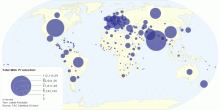
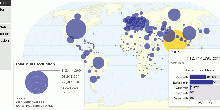
Global Distribution of Genetically Modified (GM) Crops
This map shows global distribution of Genetically Modified (GM) crops. Current World hectarage of biotech crops: 148.6 million hectares in 2010 World hectara ...4.37 rating | 77,793 views | 2 Comments15 years ago -
Energy
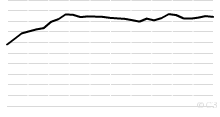
Historical World Reserves-to-production ratio of Oi ...
This chart shows the Historical World Reserves-to-production ratio of Oil - 1980 onwards. Current World Reserves-to-production ratio of Oil: 42.11 Years What D ...4.17 rating | 23,991 views | Discuss this17 years ago -
Energy
Current Worldwide Reserves-to-production ratio of N ...
This chart shows the Current Worldwide Reserves-to-production ratio of Natural Gas. Current World Reserves-to-production ratio of Natural Gas: 60.35 Years What ...4.15 rating | 15,612 views | 1 Comment17 years ago -
Energy
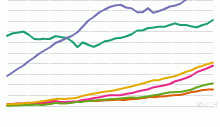
Historical Natural Gas Production by Region, 1970 t ...
This chart shows the historical Natural Gas Production - 1970 onwards. List of countries included in each region: North America includes United States,Canad ...4.11 rating | 13,090 views | Discuss this17 years ago -
Food & Agriculture
Current Worldwide Total Milk Production
This map shows current worldwide total Milk production. World Total Milk Production: 703,996,079 tonnes per year Note: Total Milk = Cow milk + Buffalo milk + G ...4.41 rating | 121,442 views | 4 Comments15 years ago -
Energy
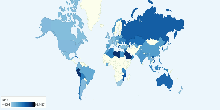
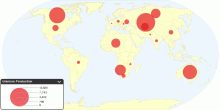
Current Worldwide Uranium Production
This map shows current worldwide uranium production from mines. A prominent use of uranium from mining is as fuel for nuclear power plants. The worldwide product ...4.33 rating | 27,972 views | 1 Comment16 years ago -
Drugs & Crime
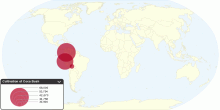
Current Worldwide Illicit Cultivation of Coca Bush ...
This chart shows current worldwide illicit cultivation of coca bush and production of cocaine. Total area under coca bush cultivation: 158,800 hectares (h ...3.22 rating | 23,286 views | Discuss this16 years ago -
Energy
Historical World Reserves-to-production ratio of Na ...
This chart shows the Historical World Reserves-to-production ratio of Natural Gas - 1980 onwards. Current World Reserves-to-production ratio of Natural Gas: 60. ...5.00 rating | 10,800 views | Discuss this17 years ago -
Food & Agriculture
Global Milk Production and Consumption
This map shows current worldwide Milk production and consumption. World Total Milk Production: 703,996,079 tonnes per year World Total Milk Consumption (excludin ...4.39 rating | 127,839 views | 8 Comments15 years ago -
Food & Agriculture
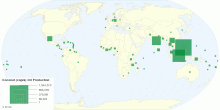
Worldwide Coconut (copra) Oil Production
This map shows worldwide coconut (copra) oil production in tonnes. Current world Coconut oil production: 3,734,208 tonnes What is Copra? Copra is dried sectio ...3.82 rating | 11,478 views | Discuss this15 years ago