-
Energy
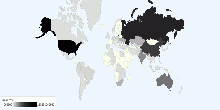
Current Worldwide Coal reserves
This chart shows current Coal Proved Reserves in the world. Current Coal Proved Reserves in the World: 820,001,000,000 tonnes4.06 rating | 20,468 views | Discuss this17 years ago -
Energy
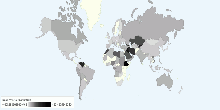
Current Worldwide Reserves-to-production ratio of Oil
This chart shows the Current World Reserves-to-production ratio of Oil. Current World Reserves-to-production ratio of Oil: 42.11 Years What Does Reserves to Pr ...4.12 rating | 26,605 views | 1 Comment17 years ago -
Energy
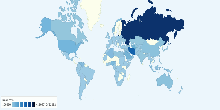
Current Worldwide Natural Gas reserves
This chart shows current Natural Gas reserves in the world. Current Natural Gas reserves in the World: 184,573,964,748,442 cubic meters (cu m or m³)4.11 rating | 22,486 views | 20 Comments17 years ago -
Energy
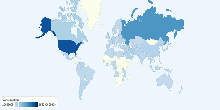
Current Worldwide Natural Gas Consumption
This chart shows current Natural Gas Consumption in the world. Current Natural Gas Consumption in the World: 3,015,443,467,227 cubic meters (m³)4.03 rating | 13,952 views | 4 Comments17 years ago -
Energy
Current Worldwide Natural Gas Consumption per capita
This chart shows current Natural Gas Consumption in the world. Current Natural Gas Consumption in the World: 444.1 cubic meters (m³) per capita4.15 rating | 13,756 views | Discuss this17 years ago -
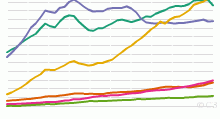
Energy
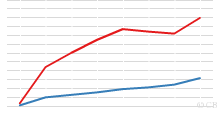
Historical Oil Consumption by Region, 1965 to Present
This chart shows the historical Oil Consumption in barrels per day - 1965 onwards. List of countries included in each region: North America includes United ...4.07 rating | 46,979 views | 2 Comments17 years ago -
Religion
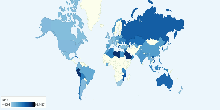
Christianity Adherents by Country
This chart shows current christianity adherents by Country. Christianity includes Roman Catholics, Protestants, Orthodox, Anglicans and Other Christianity. Numb ...3.74 rating | 37,967 views | Discuss this17 years ago -
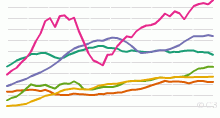
Energy
Historical Oil Production by Region, 1965 to Present
This chart shows the historical Oil Production - 1965 onwards. List of countries included in each region: North America includes United States,Canada and Me ...4.41 rating | 45,658 views | 5 Comments17 years ago -
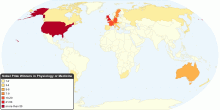
People
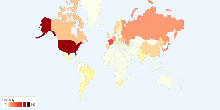
Nobel Prize Winners in Physiology or Medicine by Country
This chart shows current Nobel Prize Winners in Physiology or Medicine ranked by country. The Nobel Prize Winners in Physiology or Medicine has been awarded 196 ...4.38 rating | 24,792 views | Discuss this16 years ago -
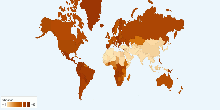
Health
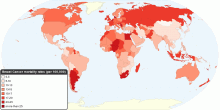
Current Worldwide Breast Cancer Mortality Rate
This map shows current worldwide Breast Cancer Age-standardised mortality rates. Breast cancer is by far the most frequent cancer among women with an estimated 1 ...4.57 rating | 39,987 views | 1 Comment16 years ago -
Social
Worldwide Distribution of Suicides Rates by Gender ...
This chart shows worldwide distribution of suicides rates by gender and age for year 2000. Suicide is among the three leading causes of death among those aged 15 ...4.08 rating | 48,678 views | 3 Comments16 years ago -
Energy
Current Nuclear Electricity Generation by Country
This chart shows current Nuclear Electricity Generation worldwide. Current Nuclear Electricity Generation: 2601 billion kWh from 436 nuclear power reactors Not ...4.60 rating | 17,076 views | 1 Comment17 years ago -
Energy
Current Worldwide Reserves-to-production ratio of N ...
This chart shows the Current Worldwide Reserves-to-production ratio of Natural Gas. Current World Reserves-to-production ratio of Natural Gas: 60.35 Years What ...4.15 rating | 15,612 views | 1 Comment17 years ago -
Energy
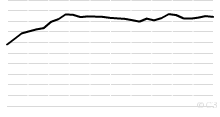
Historical World Reserves-to-production ratio of Oi ...
This chart shows the Historical World Reserves-to-production ratio of Oil - 1980 onwards. Current World Reserves-to-production ratio of Oil: 42.11 Years What D ...4.17 rating | 23,991 views | Discuss this17 years ago -
Energy
Historical Natural Gas Consumption by Region, 1965 ...
This chart shows the historical Natural Gas Consumption - 1965 onwards. List of countries included in each region: North America includes United States,Cana ...4.40 rating | 13,943 views | Discuss this17 years ago