-
Energy
Current Worldwide Natural Gas Consumption per capita
This chart shows current Natural Gas Consumption in the world. Current Natural Gas Consumption in the World: 444.1 cubic meters (m³) per capita4.15 rating | 13,756 views | Discuss this17 years ago -
Energy
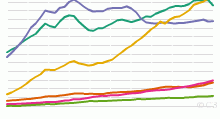
Historical Oil Consumption by Region, 1965 to Present
This chart shows the historical Oil Consumption in barrels per day - 1965 onwards. List of countries included in each region: North America includes United ...4.07 rating | 46,979 views | 2 Comments17 years ago -
Energy
Historical Natural Gas Consumption by Region, 1965 ...
This chart shows the historical Natural Gas Consumption - 1965 onwards. List of countries included in each region: North America includes United States,Cana ...4.40 rating | 13,944 views | Discuss this17 years ago -
Food & Agriculture
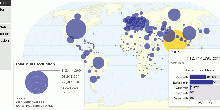
Global Milk Production and Consumption
This map shows current worldwide Milk production and consumption. World Total Milk Production: 703,996,079 tonnes per year World Total Milk Consumption (excludin ...4.39 rating | 127,839 views | 8 Comments15 years ago -
Drugs & Crime
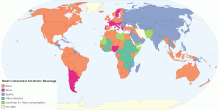
Most Consumed Alcoholic Beverage by Country
This map shows worldwide distribution of most consumed alcoholic (beer, wine, spirits or other alcoholic) beverages, in litres of pure alcohol. Key findings for ...4.53 rating | 763,087 views | 3 Comments15 years ago -
Environment
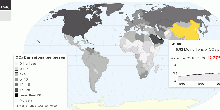
Current Worldwide CO₂ Emissions from the Consumpt ...
This map shows current and historical worldwide carbon dioxide(CO₂) emissions from the consumption of energy. Data includes emissions due to the consumption of ...4.53 rating | 41,460 views | Discuss this15 years ago -
Food & Agriculture
Global Nutrition Consumption and BMI
This map shows worldwide nutrition consumption and body mass index data. The dietary energy consumption per person is the amount of food, in kcal per day, for ea ...3.95 rating | 105,175 views | 7 Comments15 years ago -
Environment
Global Carbon Dioxide Emissions
This maps shows current worldwide carbon dioxide(CO₂) emissions and per capita emissions from the consumption of energy. Data includes emissions due to the con ...4.69 rating | 39,505 views | 1 Comment15 years ago