-
Economic
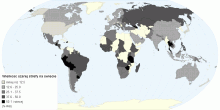
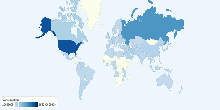
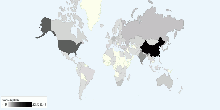
wielkosc szarej strefy na swiecie
shadow economy (informal sector) in the world (% of GDP)5.00 rating | 4,934 views | Discuss this12 years ago -
Country Info
Malaysia Regional Dataset October 2013
Dataset contains data on population, education, Health, Agriculture, Energy and econimics of the Malaysia over the period from 1955 to 2012.1.00 rating | 1,481 views | Discuss this12 years ago -
Energy
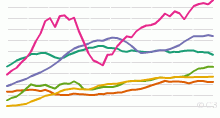
Historical Oil Production by Region, 1965 to Present
This chart shows the historical Oil Production - 1965 onwards. List of countries included in each region: North America includes United States,Canada and Me ...4.41 rating | 45,658 views | 5 Comments17 years ago -
Energy
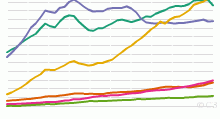
Historical Oil Consumption by Region, 1965 to Present
This chart shows the historical Oil Consumption in barrels per day - 1965 onwards. List of countries included in each region: North America includes United ...4.07 rating | 46,979 views | 2 Comments17 years ago -
Energy
Historical Crude Oil prices, 1861 to Present
This chart shows the historical Crude Oil prices in US dollars per barrel - 1861 onwards. Note: 1861-1944 US Average. 1945-1983 Arabian Light posted at ...4.25 rating | 508,715 views | 9 Comments11 years ago -
Energy
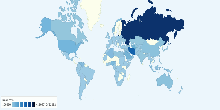
Current Worldwide Natural Gas Consumption per capita
This chart shows current Natural Gas Consumption in the world. Current Natural Gas Consumption in the World: 444.1 cubic meters (m³) per capita4.15 rating | 13,756 views | Discuss this17 years ago -
Energy
Current Worldwide Natural Gas reserves
This chart shows current Natural Gas reserves in the world. Current Natural Gas reserves in the World: 184,573,964,748,442 cubic meters (cu m or m³)4.11 rating | 22,486 views | 20 Comments17 years ago -
Energy
Current Worldwide Natural Gas Consumption
This chart shows current Natural Gas Consumption in the world. Current Natural Gas Consumption in the World: 3,015,443,467,227 cubic meters (m³)4.03 rating | 13,952 views | 4 Comments17 years ago -
Energy
Current Worldwide Reserves-to-production ratio of Oil
This chart shows the Current World Reserves-to-production ratio of Oil. Current World Reserves-to-production ratio of Oil: 42.11 Years What Does Reserves to Pr ...4.12 rating | 26,605 views | 1 Comment17 years ago -
Energy
Current Worldwide Coal reserves
This chart shows current Coal Proved Reserves in the world. Current Coal Proved Reserves in the World: 820,001,000,000 tonnes4.06 rating | 20,468 views | Discuss this17 years ago -
Energy
Current Worldwide Coal Production
This chart shows current Coal Production in the world. Current Coal Production in the World: 6,781,173,808 tonnes3.74 rating | 14,669 views | Discuss this17 years ago -
Energy
Current Worldwide Coal Consumption
This chart shows current Coal Consumption in the world. Current Coal Consumption in the World: 6,647,551,377.2 Metric Tons3.61 rating | 21,760 views | 1 Comment17 years ago -
Economic
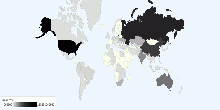
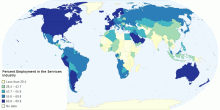
Percent Employment in the Services Industry
This map illustrates the percentage of people employed in the services industries. Because the services in the services industries are primarily delivered by peo ...4.27 rating | 10,783 views | Discuss this14 years ago -
Economic
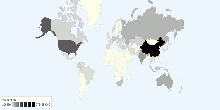
Gross Domestic Product Per Country
This map shows the GDP per Eu country in the 20110.00 rating | 3,005 views | Discuss this14 years ago -
Country Info
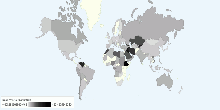
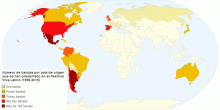
Número de bandas por país de origen que se han pr ...
Elaboración propia: Diana Karen Sánchez Espinoza. 2015. Todos los derechos reservados.5.00 rating | 1,313 views | Discuss this11 years ago