-
Others
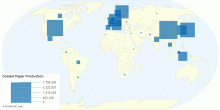
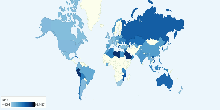
Coated Paper Production by Country
This map shows coated paper production by country. Coated paper is paper which has been coated by a compound or polymer to impart certain qualities to the paper ...5.00 rating | 7,059 views | Discuss this11 years ago -
Food & Agriculture
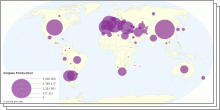
Grapes Production and Consumption by country
This map show grapes production and consumption by country. A grape is a fruiting berry of the deciduous woody vines of the botanical genus Vitis. Grapes can be ...3.50 rating | 10,529 views | Discuss this11 years ago -
Economic
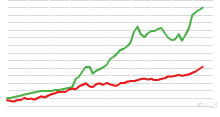
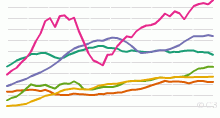
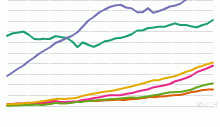
World Bicycle and Automobile Production, 1950 to Present
This chart shows World Bicycle and Automobile Production, 1950 to 2007. Note: Bicycle data include electric bicycles. 2003 bicycle data considered underestimate ...4.76 rating | 54,193 views | Discuss this16 years ago -
Others
Charcoal Import,Export and Production by country
This chart shows charcoal import,export and production details by country. Charcoal is a light, black residue, consisting of carbon and any remaining ash, obtai ...3.00 rating | 5,650 views | Discuss this11 years ago -
Others
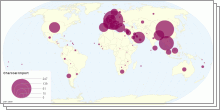
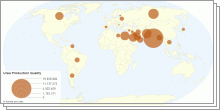
Urea Production Quality,Import and Export by country
This map shows urea production quality,import and export details by country. Urea or carbamide is an organic compound with the chemical formula CO(NH2)2. The mo ...4.00 rating | 10,007 views | Discuss this11 years ago -
Food & Agriculture
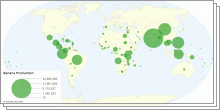
Banana Production and Consumption By Country
This map shows banana production and consumption by country. The banana plant is the largest herbaceous flowering plant. All the above-ground parts of a banana ...3.92 rating | 49,795 views | Discuss this11 years ago -
Energy
Current Worldwide Coal Production
This chart shows current Coal Production in the world. Current Coal Production in the World: 6,781,173,808 tonnes3.74 rating | 14,669 views | Discuss this17 years ago -
Energy
Current Worldwide Reserves-to-production ratio of Oil
This chart shows the Current World Reserves-to-production ratio of Oil. Current World Reserves-to-production ratio of Oil: 42.11 Years What Does Reserves to Pr ...4.12 rating | 26,608 views | 1 Comment17 years ago -
Energy
Historical Oil Production by Region, 1965 to Present
This chart shows the historical Oil Production - 1965 onwards. List of countries included in each region: North America includes United States,Canada and Me ...4.41 rating | 45,658 views | 5 Comments17 years ago -
Others
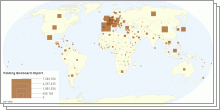
Folding Boxboard Import,Export & Production by country
This chart shows folding boxboard import,export & production by country. Folding boxboard, also referred to as FBB or by the DIN Standard 19303 codes of GC ...5.00 rating | 4,935 views | Discuss this11 years ago -
Food & Agriculture
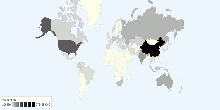
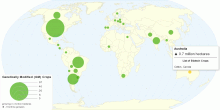
Global Distribution of Genetically Modified (GM) Crops
This map shows global distribution of Genetically Modified (GM) crops. Current World hectarage of biotech crops: 148.6 million hectares in 2010 World hectara ...4.37 rating | 77,793 views | 2 Comments15 years ago -
Drugs & Crime
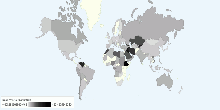
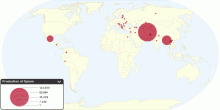
Current Worldwide Illicit Cultivation of Opium Popp ...
This chart shows current worldwide illicit cultivation of opium poppy and production of opium. Total area under opium poppy cultivation in the major culti ...4.19 rating | 185,608 views | Discuss this16 years ago -
Energy
Current Worldwide Reserves-to-production ratio of N ...
This chart shows the Current Worldwide Reserves-to-production ratio of Natural Gas. Current World Reserves-to-production ratio of Natural Gas: 60.35 Years What ...4.15 rating | 15,612 views | 1 Comment17 years ago -
Energy
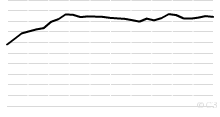
Historical World Reserves-to-production ratio of Oi ...
This chart shows the Historical World Reserves-to-production ratio of Oil - 1980 onwards. Current World Reserves-to-production ratio of Oil: 42.11 Years What D ...4.17 rating | 23,991 views | Discuss this17 years ago -
Energy
Historical Natural Gas Production by Region, 1970 t ...
This chart shows the historical Natural Gas Production - 1970 onwards. List of countries included in each region: North America includes United States,Canad ...4.11 rating | 13,090 views | Discuss this17 years ago