-
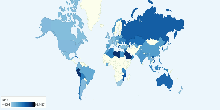
Country Info
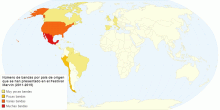
Número de bandas por país de origen que se han pr ...
Mapa hecho a base de invetsigación propia: Diana Karen Sánchez Espinoza, 2015. Derechos reservados.5.00 rating | 1,369 views | Discuss this11 years ago -
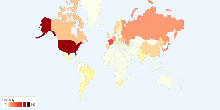
Country Info
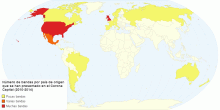
Número de bandas por país de origen que se han pr ...
Elaboración propia, Diana Karen Sánchez Espinoza, 20150.00 rating | 1,184 views | Discuss this11 years ago -
Energy
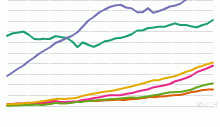
Historical Natural Gas Production by Region, 1970 t ...
This chart shows the historical Natural Gas Production - 1970 onwards. List of countries included in each region: North America includes United States,Canad ...4.11 rating | 13,090 views | Discuss this17 years ago -
Energy
Historical Natural Gas Consumption by Region, 1965 ...
This chart shows the historical Natural Gas Consumption - 1965 onwards. List of countries included in each region: North America includes United States,Cana ...4.40 rating | 13,944 views | Discuss this17 years ago -
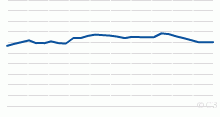
Energy
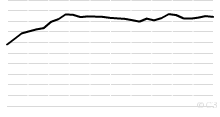
Historical World Reserves-to-production ratio of Oi ...
This chart shows the Historical World Reserves-to-production ratio of Oil - 1980 onwards. Current World Reserves-to-production ratio of Oil: 42.11 Years What D ...4.17 rating | 23,991 views | Discuss this17 years ago -
Energy
Current Worldwide Reserves-to-production ratio of N ...
This chart shows the Current Worldwide Reserves-to-production ratio of Natural Gas. Current World Reserves-to-production ratio of Natural Gas: 60.35 Years What ...4.15 rating | 15,612 views | 1 Comment17 years ago -
Energy
Current Nuclear Electricity Generation by Country
This chart shows current Nuclear Electricity Generation worldwide. Current Nuclear Electricity Generation: 2601 billion kWh from 436 nuclear power reactors Not ...4.60 rating | 17,076 views | 1 Comment17 years ago -
Energy
Historical World Reserves-to-production ratio of Na ...
This chart shows the Historical World Reserves-to-production ratio of Natural Gas - 1980 onwards. Current World Reserves-to-production ratio of Natural Gas: 60. ...5.00 rating | 10,800 views | Discuss this17 years ago -
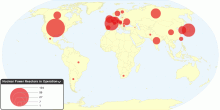
Energy
Current Nuclear Power Reactors in Operation by Country
This chart shows current Nuclear Power Reactors in operation worldwide. Number of nuclear power reactors in operation: 436 with a total net installed capacity of ...5.00 rating | 14,891 views | Discuss this17 years ago -
Energy
Current Nuclear Power Reactors in Operation by Type
This chart shows current Nuclear Power Reactors in operation by type. Number of nuclear power reactors in operation: 436 with a total net installed capacity of ...4.78 rating | 17,523 views | Discuss this17 years ago -
Energy
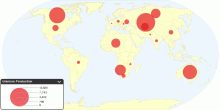
Current Worldwide Uranium Production
This map shows current worldwide uranium production from mines. A prominent use of uranium from mining is as fuel for nuclear power plants. The worldwide product ...4.33 rating | 27,973 views | 1 Comment16 years ago -
Economic
World financial flows
This is map. Yeah.5.00 rating | 2,597 views | Discuss this10 years ago -
Environment
Current Worldwide CO₂ Emissions from the Consumpt ...
This map shows current and historical worldwide carbon dioxide(CO₂) emissions from the consumption of energy. Data includes emissions due to the consumption of ...4.53 rating | 41,460 views | Discuss this15 years ago -
Economic
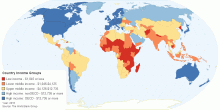
Country Income Groups (World Bank Classification)
This map classifies all World Bank member economies and all other economies with populations of more than 30,000 for operational and analytical purposes. Economi ...4.42 rating | 498,817 views | 15 Comments10 years ago -
Country Info
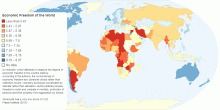
Economic Freedom of the World 2015
An indicator which attempts to measure the degree of economic freedom in the world's nations. According to the authors, the cornerstones of economic freedom ...2.00 rating | 3,715 views | Discuss this10 years ago