-
Energy
Historical Natural Gas Consumption by Region, 1965 ...
This chart shows the historical Natural Gas Consumption - 1965 onwards. List of countries included in each region: North America includes United States,Cana ...4.40 rating | 13,944 views | Discuss this17 years ago -
Energy
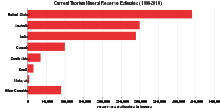
Current Thorium Mineral Reserve Estimates (1996–2010)
This chart show current Thorium mineral reserve estimates (1996–2010). Thorium consumption worldwide is relatively small compared with that of most other ...3.86 rating | 8,628 views | Discuss this15 years ago -
Food & Agriculture
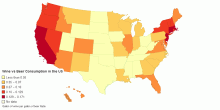
Wine vs Beer Consumption in the US
Wine/Beer Consumption in the United States Data Source: © Copyright, 2011 Beer Institute Washington, DC3.00 rating | 7,729 views | Discuss this14 years ago -
Country Info
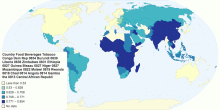
Income elasticities for broad consumption categorie ...
OK0.00 rating | 2,336 views | Discuss this14 years ago -
Drugs & Crime
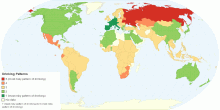
Worldwide Alcohol Drinking Patterns
This map shows worldwide alcohol drinking patterns. Alcohol drinking patterns is based on Patterns of Drinking Score. What is the Patterns of Drinking Score (PD ...4.33 rating | 34,019 views | 1 Comment15 years ago -
Health
Proportion of Population Below Minimum Level of Die ...
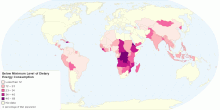
This map shows proportion population below minimum level of dietary energy consumption. World: 13% of total population (848 million) Undernourishment refers to ...4.76 rating | 24,611 views | Discuss this15 years ago -
Health
Population Below Minimum Level of Dietary Energy Co ...
This map shows population below minimum level of dietary energy consumption. World: 848 million (13% of total population) Undernourishment refers to the condit ...3.67 rating | 19,523 views | Discuss this15 years ago -
Food & Agriculture
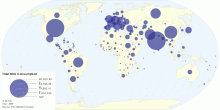
Current Worldwide Total Milk Consumption
This map shows current worldwide total Milk consumption (excluding butter). World Total Milk Consumption: 558,983,380 tonnes per year4.47 rating | 43,852 views | Discuss this15 years ago -
Food & Agriculture
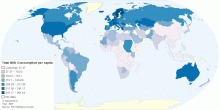
Current Worldwide Total Milk Consumption per capita
This map shows current worldwide total Milk consumption (excluding butter) per capita. World Average Milk Consumption: 108 kg per person per year4.51 rating | 265,223 views | Discuss this15 years ago -
Country Info
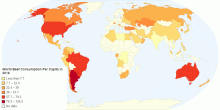
World Beef Consumption Per Capita in 2016
World Beef Consumption Per Capita in 2016 form the FSA/USDA0.00 rating | 1,961 views | Discuss this6 years ago -
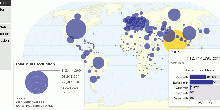
Environment
Current Worldwide CO₂ Emissions from the Consumpt ...
This map shows current and historical worldwide carbon dioxide(CO₂) emissions from the consumption of energy. Data includes emissions due to the consumption of ...4.53 rating | 41,463 views | Discuss this15 years ago -
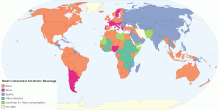
Drugs & Crime
Most Consumed Alcoholic Beverage by Country
This map shows worldwide distribution of most consumed alcoholic (beer, wine, spirits or other alcoholic) beverages, in litres of pure alcohol. Key findings for ...4.53 rating | 763,090 views | 3 Comments15 years ago -
Food & Agriculture
Global Milk Production and Consumption
This map shows current worldwide Milk production and consumption. World Total Milk Production: 703,996,079 tonnes per year World Total Milk Consumption (excludin ...4.39 rating | 127,840 views | 8 Comments15 years ago -
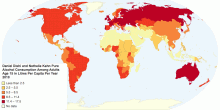
Country Info
Daniel Dishi and Nathalie Kahn
Pure Alcohol Consumption Among Adults Age 15 in Litres Per Capita Per Year 20100.00 rating | 2,823 views | Discuss this11 years ago -
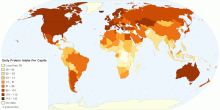
Food & Agriculture
Daily Protein Intake Per Capita
This map shows dietary protein consumption per person. The dietary protein consumption per person is the amount of protein in food, in grams per day, for each in ...4.60 rating | 149,684 views | 1 Comment15 years ago