-
Social
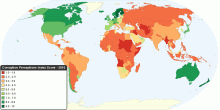
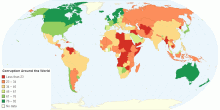
Corruption around the World
This chart shows Corruption Perceptions Index (CPI) around the world. The CPI index score on a scale from 10 (very clean) to 0 (highly corrupt). 2010 CPI key fi ...4.52 rating | 90,933 views | 8 Comments16 years ago -
Social
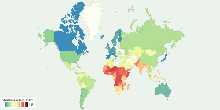
World Child Development Index
This chart shows the Child Development Index (CDI) around the world. World Performance CDI Score: 17.5 Time period: 2000-2006 Education: 11.4 H ...4.13 rating | 29,337 views | Discuss this16 years ago -
Social
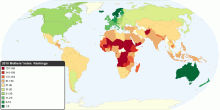
The Best and Worst Countries to Be a Mother
This map shows 2010 Mothers' Index around the world. The Mothers' Index helps document conditions for mothers and children in 160 countries (43 developed nations ...4.00 rating | 49,913 views | 8 Comments16 years ago -
Country Info
Legatum Prosperity Index Rankings
The ranking of countries in the 2012 Legatum Prosperity Index, a holistic representation of worldwide prosperity.2.33 rating | 5,324 views | Discuss this13 years ago -
Country Info
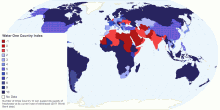
Water: One Country Index
World Bank data (2011) Reserve: Renewable internal freshwater resources (billion cubic meters) World Bank Withdrawal: Annual Freshwater Withdra ...3.29 rating | 5,451 views | Discuss this13 years ago -
Social
Corruption Around the World
This chart shows Corruption Perceptions Index (CPI) around the world. The CPI index score on a scale from 100 (very clean) to 0 (highly corrupt) What is the Cor ...4.03 rating | 14,869 views | Discuss this11 years ago -
Energy
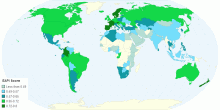
Global Energy Architecture Performance Index 2015
This chart shows the Global Energy Architecture Performance Index 2015.. The EAPI is a composite index that focuses on tracking specific indicators to measure ...5.00 rating | 4,969 views | Discuss this10 years ago -
Country Info
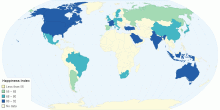
Happiness Index
World Happiness Index1.00 rating | 4,005 views | Discuss this10 years ago -
Economic
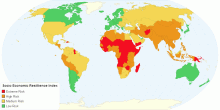
Socio Economic Resillience Index
This chart Shows Socio-economic Resillience Index by Country. Economic resilence is the ability of a local economy to retain function, employment and prosperit ...2.60 rating | 5,937 views | Discuss this10 years ago -
Education
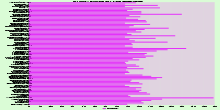
H - Index Ranking of Living Chemists
This chart shows H-index ranking of living chemists. Chemistry is a branch of physical science that studies the composition, structure, properties and change of ...2.85 rating | 21,527 views | Discuss this10 years ago -
Economic
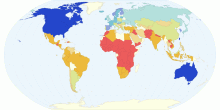
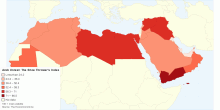
Arab Unrest: The Shoe Thrower's Index
This map shows the Shoe Thrower's Index. The Shoe Thrower's Index is an index of unrest in the Arab world published by the Economist Newspaper Limited. ...4.33 rating | 6,003 views | Discuss this15 years ago -
Tourism
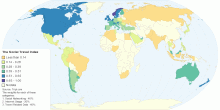
The Social Travel Index - A Country Perspective
This map shows the Social Travel Index created by Peter Sullivan Tripl Co-Founder. The Internet has allowed the world to become a much more global environment w ...3.67 rating | 7,424 views | 1 Comment15 years ago -
Country Info
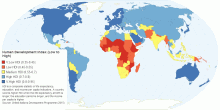
Human Development Index (Low to High)
HDI is a composite statistic of life expectancy, education, and income per capita indicators. A country scores higher HDI when the life expectancy at birth is lo ...3.29 rating | 7,514 views | Discuss this10 years ago -
Social
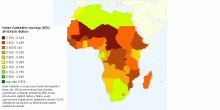
Index ľudského rozvoja (HDI) afrických štátov
Mapa zobrazuje 53 afrických štátov a ich rôzne indexi ľudského rozvoja. Podľa mapy vieme ľahko určiť, ktoré &s ...5.00 rating | 1,844 views | Discuss this5 years ago -
Health
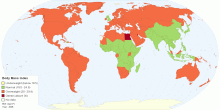
Body Mass Index (BMI) by Country
This map shows World trends in age-standardized mean Body Mass Index (BMI) 199 countries over 28 years. The worldwide prevalence of obesity has nearly doubled s ...4.12 rating | 199,858 views | 11 Comments15 years ago