-
Environment
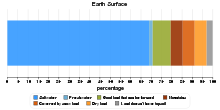
Earth Surface
This chart shows Earth surface. ~70% water and ~29% land surface4.37 rating | 11,920 views | Discuss this15 years ago -
Country Info
Chloropleth to Show Hiv in Different Areas of Earth
This chloropleth shows the distribution of HIV in different areas of the earth. This occurs more frequently in the southern region of africa. on the contrary, th ...0.00 rating | 1,368 views | Discuss this11 years ago -
Country Info
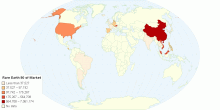
Rare Earth Exports 2010
90% of market repreesnted5.00 rating | 2,002 views | Discuss this14 years ago -
Country Info
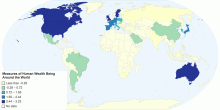
Measures of Human Wealth Being Around the World
Measures of wealth distribution throughout the world1.00 rating | 2,233 views | Discuss this13 years ago -
Environment
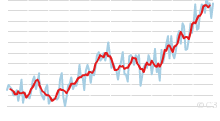
Historical Global Land-Ocean Temperatures, 1880 to Present
The time series shows the combined global land and ocean surface temperature record from 1880 to present, with the base period 1951-1980. How data were collecte ...3.97 rating | 29,112 views | 3 Comments16 years ago -
Country Info
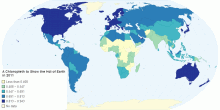
A Chloropleth to Show the Hdi of Earth in 2011
This chloropleth shows the human development index in 2011. The North divide is on average mor developed than the south, especially North America. Africa seemed ...0.00 rating | 1,492 views | Discuss this11 years ago -
Environment
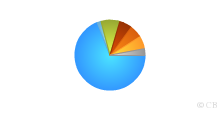
Composition of the Universe
This chart shows composition of the Universe. According to the latest observational evidence, ordinary matter, including stars, planets, dust and gas, only make ...4.38 rating | 184,231 views | 6 Comments16 years ago -
Environment
Surface Area of the Earth
This chart shows total surface area of earth. Total surface area of earth: 510,072,000 sq km Total water surface area: 70.8% (361,132,000 sq km) Tot ...4.44 rating | 383,219 views | 19 Comments16 years ago -
Food & Agriculture
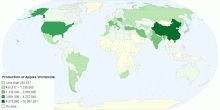
Production of Apples Worldwide
The apple production in tonnes worldwide.3.00 rating | 3,730 views | Discuss this13 years ago -
Food & Agriculture
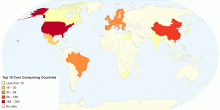
Top 10 Corn Consuming Countries
Corn Consumption1.00 rating | 2,937 views | Discuss this12 years ago -
Population
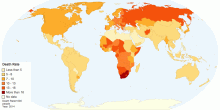
Death Rate
This map shows the death rate per 1000 people. The dark red is where there is the highest death rate whereas the light orange has a low death rate.0.00 rating | 3,367 views | Discuss this12 years ago -
Food & Agriculture
Top 10 Corn Consuming Countries
Consuming0.00 rating | 2,405 views | Discuss this12 years ago