-
Economic
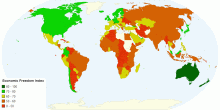
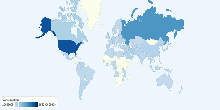
2015 Index of Economic Freedom
This chart shows the Economic Freedom Index for the year 2015 by Country. The Index of Economic Freedom is an annual index and ranking created by The Heritage ...3.91 rating | 9,705 views | Discuss this10 years ago -
Energy
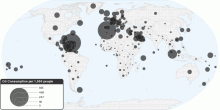
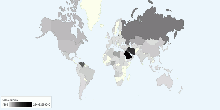
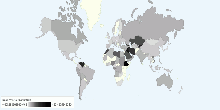
Current Worldwide Oil Consumption per 1000 people
This chart shows current oil consumption (per capita) in the world. Current Oil Consumption in the World: 31.1 barrels per day (bbl/day) per 1,000 people 1 b ...3.48 rating | 29,447 views | Discuss this16 years ago -
Energy
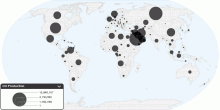
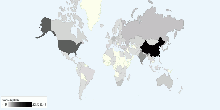
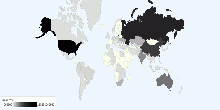
Current Worldwide Oil Production
This chart shows current oil production in the world. Current Oil Production in the World: 81,820,404.59 barrels per day (bbl/day) 1 barrel = (42 US gallons, 158 ...4.04 rating | 65,897 views | 13 Comments16 years ago -
Energy
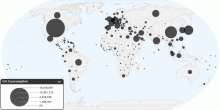
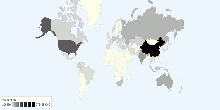
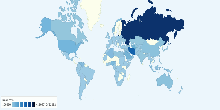
Current Worldwide Oil Consumption
This chart shows current oil consumption in the world. Current Oil Consumption in the World: 84,455,330 barrels per day (bbl/day) 1 barrel = (42 US gallons, 158. ...3.96 rating | 47,692 views | 42 Comments16 years ago -
Energy
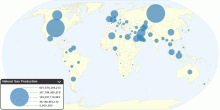
Current Worldwide Natural Gas Production
This chart shows current Natural Gas Production in the world. Current Natural Gas Production in the World: 3,065,690,558,538 cubic meters (cu m)3.86 rating | 20,178 views | Discuss this17 years ago -
Energy
Current Worldwide Oil reserves
This chart shows current Oil reserves in the world. Current Oil reserves in the World: 1,248,795,488,139 barrels (bbl) (42 US gallons, 158.9873 litres,or 34.9723 ...3.80 rating | 27,944 views | 10 Comments17 years ago -
Energy
Current Worldwide Coal Consumption
This chart shows current Coal Consumption in the world. Current Coal Consumption in the World: 6,647,551,377.2 Metric Tons3.61 rating | 21,760 views | 1 Comment17 years ago -
Energy
Current Worldwide Coal Production
This chart shows current Coal Production in the world. Current Coal Production in the World: 6,781,173,808 tonnes3.74 rating | 14,669 views | Discuss this17 years ago -
Energy
Current Worldwide Coal reserves
This chart shows current Coal Proved Reserves in the world. Current Coal Proved Reserves in the World: 820,001,000,000 tonnes4.06 rating | 20,468 views | Discuss this17 years ago -
Energy
Current Worldwide Reserves-to-production ratio of Oil
This chart shows the Current World Reserves-to-production ratio of Oil. Current World Reserves-to-production ratio of Oil: 42.11 Years What Does Reserves to Pr ...4.12 rating | 26,600 views | 1 Comment17 years ago -
Energy
Current Worldwide Natural Gas reserves
This chart shows current Natural Gas reserves in the world. Current Natural Gas reserves in the World: 184,573,964,748,442 cubic meters (cu m or m³)4.11 rating | 22,486 views | 20 Comments17 years ago -
Energy
Current Worldwide Natural Gas Consumption
This chart shows current Natural Gas Consumption in the world. Current Natural Gas Consumption in the World: 3,015,443,467,227 cubic meters (m³)4.03 rating | 13,952 views | 4 Comments17 years ago -
Energy
Current Worldwide Natural Gas Consumption per capita
This chart shows current Natural Gas Consumption in the world. Current Natural Gas Consumption in the World: 444.1 cubic meters (m³) per capita4.15 rating | 13,756 views | Discuss this17 years ago -
Energy
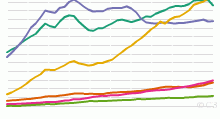
Historical Oil Consumption by Region, 1965 to Present
This chart shows the historical Oil Consumption in barrels per day - 1965 onwards. List of countries included in each region: North America includes United ...4.07 rating | 46,979 views | 2 Comments17 years ago -
Energy
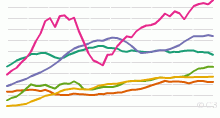
Historical Oil Production by Region, 1965 to Present
This chart shows the historical Oil Production - 1965 onwards. List of countries included in each region: North America includes United States,Canada and Me ...4.41 rating | 45,658 views | 5 Comments17 years ago