-
People
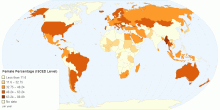
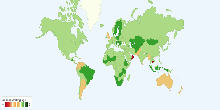
ISCED Level of Female Percentage by Country
This chart shows ISCED(International Standard Classification of Education) Level of Female Percentage. The International Standard Classification of Educati ...5.00 rating | 4,929 views | Discuss this11 years ago -
Education
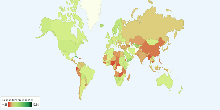
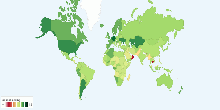
Current Worldwide Public Expenditure on Education a ...
This chart shows public expenditure in a given financial year on education as a percentage of GDP. Public expenditure on education as a percentage of GDP gives ...4.36 rating | 31,445 views | 1 Comment17 years ago -
Education
Transparency International School on Integrity 2015
This chart shows Transparency International School on Integrity 2015 by Country. Transparency International School on Integrity (TISI) is an annual state-of-the ...5.00 rating | 7,066 views | Discuss this10 years ago -
Education
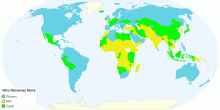
Who Receives More Education
This chart shows Who Receives More Education. Education is the process of facilitating learning, or the acquisition of knowledge, skills, values, beliefs, and h ...3.80 rating | 10,685 views | Discuss this10 years ago -
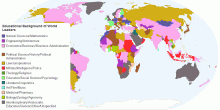
Country Info
Educational Background of World Leaders
This chart shows the Educational Background of World Leaders by country.This amazing map takes a look at what the world leaders studied for the highest degree th ...3.91 rating | 10,517 views | Discuss this11 years ago -
Education
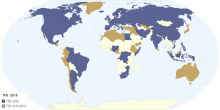
Upper Secondary Education Theoretical Entry Age
This chart shows upper secondary education theoretical entry age details by country. Secondary education normally takes place in secondary schools, taking place ...3.67 rating | 8,498 views | Discuss this11 years ago -
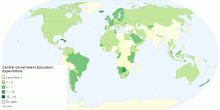
Education
Central Government Allocated Expenditure For Education
This charts shows central government allocated education expenditure details by country. General government expenditure on education (current, capital, and tran ...4.43 rating | 9,538 views | Discuss this11 years ago -
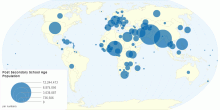
Education
Post Secondary School Age Population by Country
This map shows post secondary school age population by country. Postsecondary education refers to those whose highest level of educational attainment is an appr ...5.00 rating | 7,013 views | Discuss this11 years ago -
Education
Duration of Compulsory Education around the World
This chart shows duration of compulsory education around the world. Compulsory education means number of years that children are legally obliged to attend school ...3.92 rating | 57,602 views | 6 Comments17 years ago -
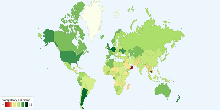
Education
Starting Age of Compulsory Education around the World
This chart shows official school starting age of compulsory education around the world. Average official school starting age of compulsory education: 5.9 years ...4.06 rating | 59,946 views | 8 Comments17 years ago -
Education
Ending Age of Compulsory Education around the World
This chart shows ending age of compulsory education or legal school leaving age around the world. The ending age of compulsory education states the minimum age w ...3.74 rating | 34,120 views | Discuss this17 years ago -
Economic
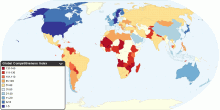
Global Competitiveness Index
This map shows 2010-2011 Global Competitiveness Index (GCI) in 139 major and emerging economies from all of the world's regions. The GCI, a highly comprehensive ...4.49 rating | 38,958 views | 3 Comments16 years ago