-
Energy
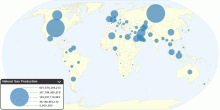
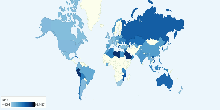
Current Worldwide Natural Gas Production
This chart shows current Natural Gas Production in the world. Current Natural Gas Production in the World: 3,065,690,558,538 cubic meters (cu m)3.86 rating | 20,181 views | Discuss this17 years ago -
Health
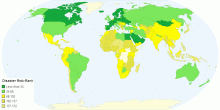
Natural Disaster Risk 2015
This chart shows the Natural Disaster Risk 2015 by country. A natural disaster is a major adverse event resulting from natural processes of the Earth; examples ...4.33 rating | 12,139 views | Discuss this10 years ago -
Energy
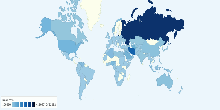
Current Worldwide Natural Gas reserves
This chart shows current Natural Gas reserves in the world. Current Natural Gas reserves in the World: 184,573,964,748,442 cubic meters (cu m or m³)4.11 rating | 22,486 views | 20 Comments17 years ago -
Energy
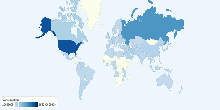
Current Worldwide Natural Gas Consumption
This chart shows current Natural Gas Consumption in the world. Current Natural Gas Consumption in the World: 3,015,443,467,227 cubic meters (m³)4.03 rating | 13,952 views | 4 Comments17 years ago -
Energy
Current Worldwide Natural Gas Consumption per capita
This chart shows current Natural Gas Consumption in the world. Current Natural Gas Consumption in the World: 444.1 cubic meters (m³) per capita4.15 rating | 13,756 views | Discuss this17 years ago -
Energy
Current Worldwide Reserves-to-production ratio of N ...
This chart shows the Current Worldwide Reserves-to-production ratio of Natural Gas. Current World Reserves-to-production ratio of Natural Gas: 60.35 Years What ...4.15 rating | 15,612 views | 1 Comment17 years ago -
Energy
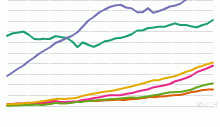
Historical Natural Gas Consumption by Region, 1965 ...
This chart shows the historical Natural Gas Consumption - 1965 onwards. List of countries included in each region: North America includes United States,Cana ...4.40 rating | 13,945 views | Discuss this17 years ago -
Energy
Historical Natural Gas Production by Region, 1970 t ...
This chart shows the historical Natural Gas Production - 1970 onwards. List of countries included in each region: North America includes United States,Canad ...4.11 rating | 13,090 views | Discuss this17 years ago -
Energy
Historical World Reserves-to-production ratio of Na ...
This chart shows the Historical World Reserves-to-production ratio of Natural Gas - 1980 onwards. Current World Reserves-to-production ratio of Natural Gas: 60. ...5.00 rating | 10,800 views | Discuss this17 years ago -
Infrastructure
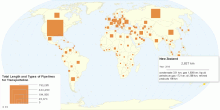
Total Length of Pipelines for Transportation by Country
This map shows list of countries by total length and types of pipelines for transporting products like natural gas, crude oil, or petroleum products. World Tota ...4.42 rating | 41,188 views | Discuss this15 years ago