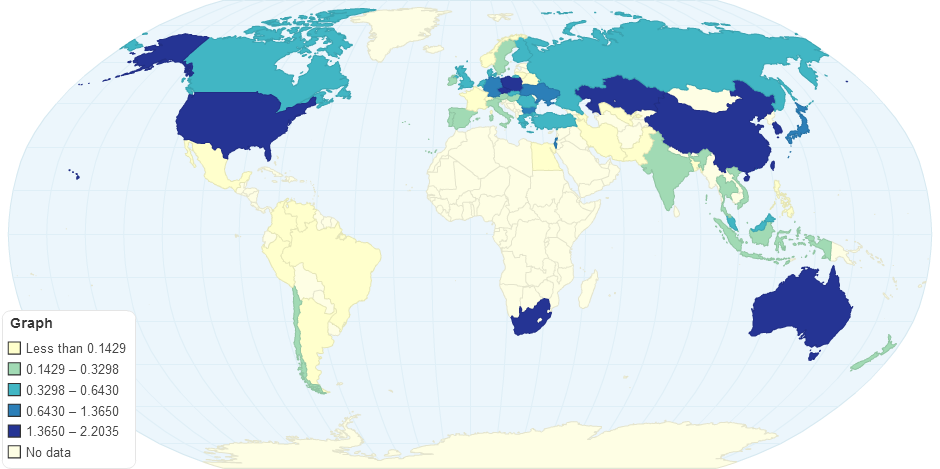
Chloropleth Graph showing the coal consumption per person in 2011
Do you like this chart?
✔ Yes
✖
✚ Share
References and Data Table
HTML Embed code
$ Buy Now
1,017 views
- Add new comment

World Coal Reserves Million Tons
3.86 rating | 6,770 views | 0 comments
World Coal Reserves (million tonnes)
3.55 rating | 7,902 views | 0 comments
Coal employment 2012, % of population
5.00 rating | 1,041 views | 0 comments
Coal consumption in 1978
0.00 rating | 876 views | 0 comments