-
Information and Communication Technology
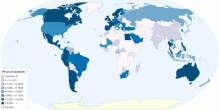
iPhone Availability
I created a map to visualize the iPhone availability. Purely mapping the countries based upon whether or not the iPhone is available is insufficient as ...5.00 rating | 4,585 views | Discuss this14 years ago -
Information and Communication Technology
iPhone Availability by Country
iPhone availability0.00 rating | 5,309 views | Discuss this14 years ago -
Information and Communication Technology
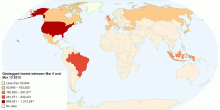
Tweets Per Country
The map visualises the number of geocoded tweets per country between March 5 and March 13 2012. More information available from Dr. Mark Graham (www.geospace.co.uk)3.00 rating | 12,995 views | Discuss this14 years ago -
Information and Communication Technology
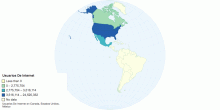
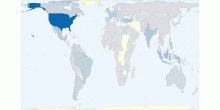
Usuarios de Internet
Usuarios de Internet en Canada, Estados Unidos y México0.00 rating | 2,410 views | Discuss this14 years ago -
Information and Communication Technology
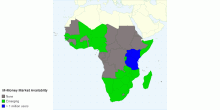
M Money Use in Sub Saharan Africa 2012
Map of M-money accounts2.33 rating | 4,094 views | Discuss this14 years ago -
Information and Communication Technology
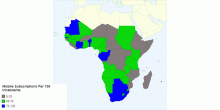
Mobile Subscriptions Per 100 Inhabitants 2010
Mobile subscriptions per 100 inhabitants0.00 rating | 4,555 views | Discuss this14 years ago -
Information and Communication Technology
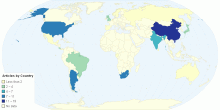
Articles by Country
Articles0.00 rating | 1,378 views | Discuss this14 years ago -
Information and Communication Technology
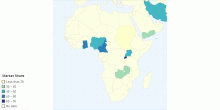
Market Share
Hello0.00 rating | 1,687 views | Discuss this14 years ago -
Information and Communication Technology
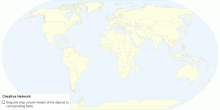
Creative Network
www.jairoamaya.net5.00 rating | 1,520 views | Discuss this14 years ago -
Information and Communication Technology
Creative Network
www.jairoamaya.net5.00 rating | 2,364 views | Discuss this14 years ago -
Information and Communication Technology
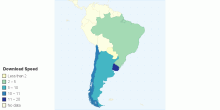
Download Speed
This reflects no known data. I'm just trying to learn how to make charts.0.00 rating | 1,867 views | Discuss this15 years ago -
Information and Communication Technology
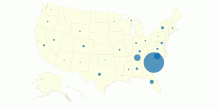
Facebook Community
This shows a distribution of my facebook friends.1.00 rating | 2,394 views | Discuss this15 years ago -
Information and Communication Technology
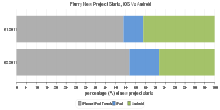
Flurry New Project Starts, iOS Vs Android
Flurry (mobile analytics firm) tracks the activity of 45,000 developers who have built 90,000 different applications. Every time a developer starts a new projec ...5.00 rating | 8,196 views | Discuss this15 years ago -
Information and Communication Technology
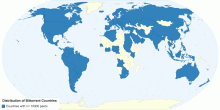
Distribution of Bittorrent Countries
This map shows countries with >=10000 peers in BitTorrent.0.00 rating | 2,033 views | Discuss this15 years ago -
Information and Communication Technology
Number of Facebook Users by Country
This map shows the number of Facebook users per country. Data taken from SocialBaker.com5.00 rating | 5,183 views | Discuss this15 years ago