-
Environment
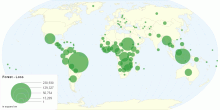
Forest Loss by Country
This chart shows Forest Loss by Country. A forest is a large area dominated by trees.Hundreds of more precise definitions of forest are used throughout the wor ...3.67 rating | 40,744 views | Discuss this9 years ago -
Environment
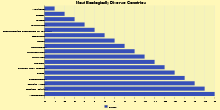
Most Ecologically Diverse Countries on Earth
This chart shows Most Ecologically Diverse Countries On Earth. Ecological diversity is a type of biodiversity. It is the variation in the ecosystems found in a ...2.96 rating | 23,281 views | 1 Comment9 years ago -
Environment
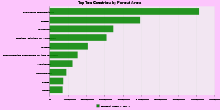
Top Ten Countries by Forest Area
This chart shows Top Ten Countries by Forest Area. A forest is a large area dominated by trees. Hundreds of more precise definitions of forest are used through ...3.75 rating | 12,984 views | Discuss this9 years ago -
Environment
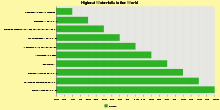
Highest Waterfalls in the World
This chart shows Highest Waterfalls in the World. A waterfall is a place where water flows over a vertical drop or a series of drops in the course of a stream ...2.82 rating | 8,827 views | Discuss this10 years ago -
Environment
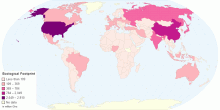
Ecological Footprint by Country
This chart shows Ecological Footprint by Country. The ecological footprint measure how much nature it takes to support people. It is an ecological accounting s ...4.02 rating | 20,764 views | Discuss this10 years ago -
Environment
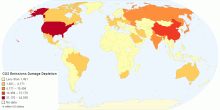
Co2 Emissions Damage Depletion by Country
This chart shows CO2 Emissions Damage Depletion by Country. Carbon dioxide(CO2) is a colorless and odorless gas that is vital to life on Earth. This naturally ...4.47 rating | 9,222 views | Discuss this10 years ago -
Environment
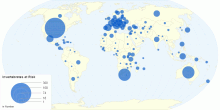
Invertebrates at Risk
This chart shows Invertebrates at Risk by Country. Invertebrates are animals that neither possess nor develop a vertebral column, derived from the notochord. Th ...3.67 rating | 7,501 views | Discuss this10 years ago -
Environment
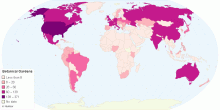
Botanical Gardens by Country
This chart shows Botanical Gardens by Country. A botanical garden or botanic garden is a garden dedicated to the collection, cultivation and display of a wide ...3.50 rating | 11,293 views | Discuss this10 years ago -
Environment
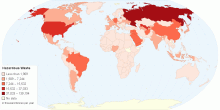
Hazardous Waste by Country
This chart shows Hazardous Waste by Country. Hazardous waste is waste that poses substantial or potential threats to public health or the environment.In the Un ...4.38 rating | 27,120 views | Discuss this10 years ago -
Environment
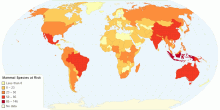
Mammal Species at Risk by Country
This chart shows Mammal Species at Risk by Country. Mammals are any vertebrates within the class Mammalia a clade of endothermic amniotes distinguished from re ...4.43 rating | 8,552 views | Discuss this10 years ago -
Environment
Globalization Index 2016
This chart shows Globalization index 2016. Globalization is the process of international integration arising from the interchange of world views, products, idea ...4.16 rating | 14,154 views | Discuss this10 years ago -
Environment
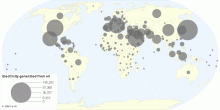
Oil Power by Country
This chart shows The Oil Power by Country. An oil is any neutral, nonpolar chemical substance that is a viscous liquid at ambient temperatures and is both hydr ...3.86 rating | 9,086 views | Discuss this10 years ago -
Environment
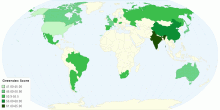
Greendex Index by Country.
This chart shows Greendex Index by Country. National Geographic/GlobeScan Consumer Greendex, a scientifically derived sustainable consumption index of actual co ...4.19 rating | 21,568 views | Discuss this10 years ago -
Environment
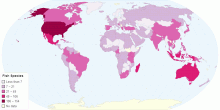
Fish Species at Risk
This chart shows Fish species at risk by Country. A fish is any member of a paraphyletic group of organisms that consist of all gill-bearing aquatic craniate an ...4.20 rating | 8,094 views | Discuss this10 years ago -
Environment
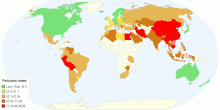
Pollution Index 2016
This chart shows Pollution Index for Country 2016. Pollution is the introduction of contaminants into the natural environment that cause adverse change.Pollutio ...4.15 rating | 63,690 views | Discuss this10 years ago