-
Environment
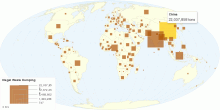
Global Illegal Waste Dumping by Country
This map shows an estimate of illegal waste dumping (in forests, public areas and elsewhere) lying around in the world by country (in tons). Total World illegal ...4.72 rating | 34,013 views | 5 Comments15 years ago -
Environment
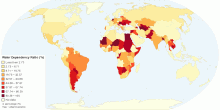
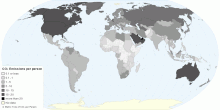
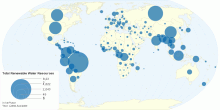
Total Renewable Water Resources Dependency Ratio by Country
This map shows the percent of total renewable water resources dependency ratio or originating outside the country. What is Dependency ratio? Dependency ratio m ...4.81 rating | 34,580 views | 2 Comments15 years ago -
Environment
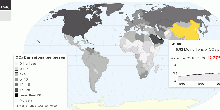
Global Carbon Dioxide Emissions
This maps shows current worldwide carbon dioxide(CO₂) emissions and per capita emissions from the consumption of energy. Data includes emissions due to the con ...4.69 rating | 39,653 views | 1 Comment15 years ago -
Environment
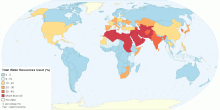
Proportion of Total Water Resources Used, percentage
This map shows worldwide surface water and ground water withdrawal as percentage of total renewable water resources. Water withdrawal is the quantity of water re ...4.64 rating | 39,727 views | Discuss this15 years ago -
Environment
Current Worldwide Carbon Dioxide Emissions per Person
This map shows current worldwide carbon dioxide(CO₂) emissions per person from the consumption of energy. Data includes emissions due to the consumption of pet ...4.79 rating | 38,670 views | Discuss this15 years ago -
Environment
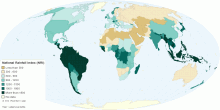
National Rainfall Index (NRI)
This map shows national rainfall index (NRI). Waht is National Rainfall Index (NRI)? A national rainfall index (NRI) is defined as the national average of the ...4.62 rating | 38,482 views | Discuss this15 years ago -
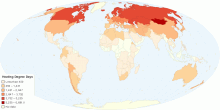
Environment
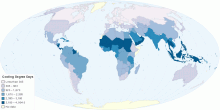
Worldwide Cooling Needs
This map shows worldwide cooling degree days. Cooling degree day (HDD) is a measurement designed to reflect the demand for energy needed to cool a home or busine ...4.64 rating | 22,660 views | 2 Comments15 years ago -
Environment
Surface Area of the Earth
This chart shows total surface area of earth. Total surface area of earth: 510,072,000 sq km Total water surface area: 70.8% (361,132,000 sq km) Tot ...4.44 rating | 385,930 views | 19 Comments17 years ago -
Environment
Current Worldwide CO₂ Emissions from the Consumpt ...
This map shows current and historical worldwide carbon dioxide(CO₂) emissions from the consumption of energy. Data includes emissions due to the consumption of ...4.53 rating | 41,645 views | Discuss this15 years ago -
Environment
Composition of the Universe
This chart shows composition of the Universe. According to the latest observational evidence, ordinary matter, including stars, planets, dust and gas, only make ...4.38 rating | 184,416 views | 6 Comments16 years ago -
Environment
Total Renewable Water Resources per capita by Country
This map shows total renewable water resources per capita by country. Current world total renewable water resources: ~24,776 m³ (cu m)/inhabitant/year ( 24 ...4.35 rating | 114,784 views | Discuss this15 years ago -
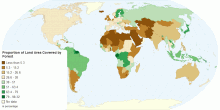
Environment
Proportion of Land Area Covered by Forest
This map shows proportion of forest area to total land area (expressed as a percentage). Forest is defined in the Food and Agriculture Organization’s (FAO ...4.32 rating | 73,363 views | 2 Comments15 years ago -
Environment
Total Renewable Water Resources by Country
This map shows total renewable water resources by country. It corresponds to the maximum theoretical yearly amount of water actually available for a country at a ...4.29 rating | 37,752 views | 4 Comments15 years ago -
Environment
Worldwide Heating Needs
This map shows worldwide heating degree days. Heating degree day (HDD) is a measurement designed to reflect the demand for energy needed to heat a home or busine ...4.30 rating | 25,566 views | 2 Comments15 years ago -
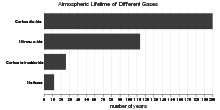
Environment
Atmospheric Lifetime of Different Greenhouse Gases
This chart shows atmospheric lifetime of different greenhouse gases. What is atmospheric lifetime? The lifetime of a greenhouse gas refers to the approximate a ...4.25 rating | 54,927 views | 3 Comments15 years ago