-
Economic
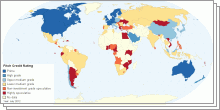
How Moody's, S&P and Fitch Rate Each Country's Cred ...
This collection of interactive maps shows credit rating for each country. What is Credit Rating? A credit rating estimates the credit worthiness of an individu ...4.41 rating | 659,728 views | 17 Comments6 years ago -
Economic
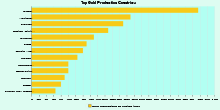
Top Gold Production Countries in the World
This chart shows Top Gold Production Countries in the world. Gold is a chemical element with symbol Au and atomic number 79. In its purest form, it is a bright, ...4.06 rating | 38,793 views | 1 Comment9 years ago -
Economic
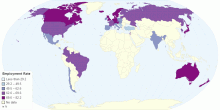
Employment Rate by Country
This chart shows Employment Rate by Country Employment is a relationship between two parties, usually based on a contract where work is paid for, where on ...4.11 rating | 40,521 views | Discuss this9 years ago -
Economic
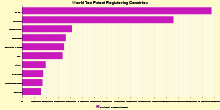
World Ten Patent Registering Countries
This chart shows World Ten Patent egistering Countries. A patent is a set of exclusive rights granted by a sovereign state to an inventor or assignee for a limi ...4.33 rating | 41,181 views | Discuss this9 years ago -
Economic
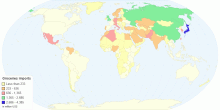
Groceries Imports by Country
This chart shows Groceries Imports by Country. A grocery store is a retail store that primarily sells food. A grocer is a bulk seller of food. Grocery stores o ...4.02 rating | 31,249 views | 1 Comment9 years ago -
Economic
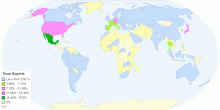
Truck Exports by Country
This chart shows Truck Exports by Country. A truck is a motor vehicle designed to transport cargo. Trucks vary greatly in size, power, and configuration; small ...3.93 rating | 8,201 views | Discuss this9 years ago -
Economic
Most Expensive Coins in the World
This chart shows List of most expensive coins. A coin is a small, flat, round piece of metal or plastic used primarily as a medium of exchange or legal tender. ...5.00 rating | 8,847 views | Discuss this9 years ago -
Economic
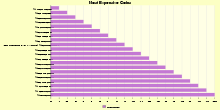
Market Hours for Men
This chart shows Market Hours for Men by Country. Marketing is the study and management of exchange relationships.The American Marketing Association has define ...4.71 rating | 7,152 views | Discuss this9 years ago -
Economic
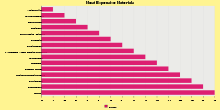
Most Expensive Materials in the World
This chart shows Most Expensive Materials in the World. Material is a broad term for a chemical substance or mixture of substances that constitute a thing.In t ...3.56 rating | 17,452 views | Discuss this9 years ago -
Economic
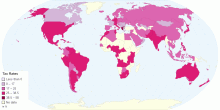
Tax Rates by Country
This chart shows Tax Rates by Country. This is a list of tax rates around the world. It focuses on Two types of tax: & ...4.38 rating | 11,307 views | Discuss this10 years ago -
Economic
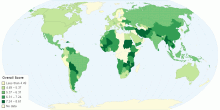
Basel Anti Money Laundering Index
This chart shows Basel Anti-Money Laundering (AML) Index by Country. The Basel AML Index is an annual ranking assessing country risk regarding money laundering/ ...4.27 rating | 14,463 views | Discuss this10 years ago -
Economic
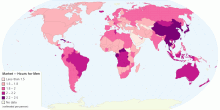
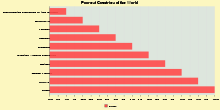
Poorest Countries of the World
This chart shows Poorest Countries of the World. Poverty is general scarcity or the state of one who lacks a certain amount of material possessions or money.It ...3.59 rating | 12,752 views | Discuss this10 years ago -
Economic
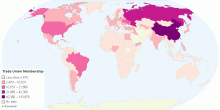
Trade Union Membership by Country
This chart shows Trade Union Membership by Country. A trade union, labour union, or labor union is an organization of workers who have come together to achieve ...3.24 rating | 13,539 views | Discuss this10 years ago -
Economic
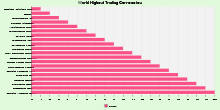
World Highest Trading Currencies
This chart World Highest Trading Currencies. A currency in the most specific use of the word refers to money in any form when in actual use or circulation as a ...4.00 rating | 8,808 views | Discuss this10 years ago -
Economic
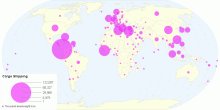
Cargo Shipping by Country
This chart shows Cargo Shipping by Country. A cargo ship or freighter is any sort of ship or vessel that carries cargo, goods, and materials from one port to a ...5.00 rating | 11,720 views | Discuss this10 years ago