-
Economic
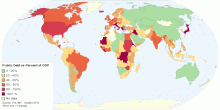
General Government Debt as Percent of GDP by Country
This interactive map shows historical data and forecast of general government gross debt (as percent of GDP) in each country. Government debt (also known as publ ...4.69 rating | 131,012 views | 11 Comments15 years ago -
Economic
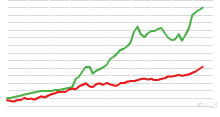
World Bicycle and Automobile Production, 1950 to Present
This chart shows World Bicycle and Automobile Production, 1950 to 2007. Note: Bicycle data include electric bicycles. 2003 bicycle data considered underestimate ...4.76 rating | 54,256 views | Discuss this16 years ago -
Economic
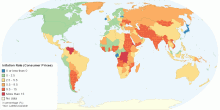
Current Inflation Rate (Consumer Prices) by Country
This map shows current Inflation Rate (consumer prices) by country. It is the annual percent change in consumer prices compared with the previous year's cons ...4.70 rating | 43,570 views | 1 Comment15 years ago -
Economic
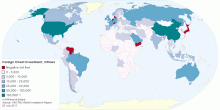
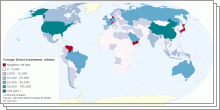
Foreign Direct Investment (FDI), inflows
This interactive map shows inflows (received) of foreign direct investment at the country-level, in million US dollars. Global foreign direct investment inflows ...4.84 rating | 56,263 views | Discuss this15 years ago -
Economic
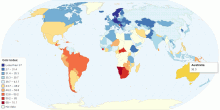
Ease of Doing Business - Rank
Thia map shows ease of doing business index, which ranks economies from 1 to 183, with first place being the best. A high ranking means that the regulatory envir ...4.61 rating | 60,526 views | Discuss this15 years ago -
Economic
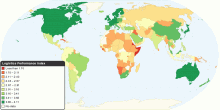
Logistics Performance Index
This map shows 2010 Logistics Performance Index (LPI). The LPI is a benchmarking tool created to help countries identify the challenges and opportunities they fa ...4.72 rating | 29,011 views | Discuss this16 years ago -
Economic
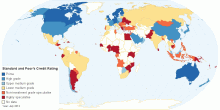
Standard & Poor's Credit Rating for each country
This map shows Standard & Poor's Credit Rating for each country. Estonia's credit rating was raised by Standard & Poor's Ratings to the se ...4.46 rating | 791,150 views | 31 Comments14 years ago -
Economic
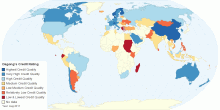
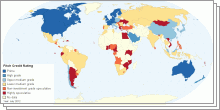
Dagong's Credit Rating for each country
This interactive map shows Dagong's credit rating for each country. Dagong Global Credit Rating is a credit rating agency based in China. It is one of the f ...4.48 rating | 88,326 views | 7 Comments15 years ago -
Economic
Foreign Investment 2011
This collection of interactive maps shows Foreign Direct Investment (FDI) at the country-level. Foreign direct investment (FDI) is a measure of foreign ownership ...4.49 rating | 64,054 views | 1 Comment15 years ago -
Economic
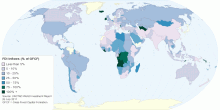
FDI Inflows as a percentage of Gross Fixed Capital ...
This interactive map shows inflows (received) of foreign direct investment (FDI) as a percentage of gross fixed capital formation at the country-level. Foreig ...4.75 rating | 20,386 views | Discuss this15 years ago -
Economic
Distribution of Family Income - Gini Index
This map shows the degree of inequality in the distribution of family income (Gini index or Gini coefficient) in each country. Income distribution measure ...4.47 rating | 80,397 views | 6 Comments15 years ago -
Economic
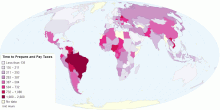
Time to Prepare and Pay Taxes (Hours)
This map indicates the time, in hours per year, it takes to prepare, file, and pay (or withhold) three major types of taxes: the corporate income tax, the value ...4.61 rating | 43,114 views | Discuss this15 years ago -
Economic
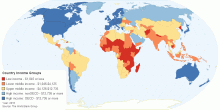
Country Income Groups (World Bank Classification)
This map classifies all World Bank member economies and all other economies with populations of more than 30,000 for operational and analytical purposes. Economi ...4.42 rating | 499,153 views | 15 Comments10 years ago -
Economic
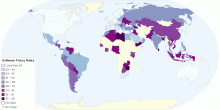
Software Piracy Rates by country
This map shows software piracy rates. World Software Piracy Rate: 43% in 2009 (41% in 2008) The rate of global software piracy climbed to 43 percent in 2009; l ...4.43 rating | 69,318 views | 3 Comments15 years ago -
Economic
How Moody's, S&P and Fitch Rate Each Country's Cred ...
This collection of interactive maps shows credit rating for each country. What is Credit Rating? A credit rating estimates the credit worthiness of an individu ...4.41 rating | 659,018 views | 17 Comments6 years ago