This chart shows World Bicycle and Automobile Production, 1950 to 2007.
Note: Bicycle data include electric bicycles. 2003 bicycle data considered underestimate, due to lack of e-bike data.
16 years ago
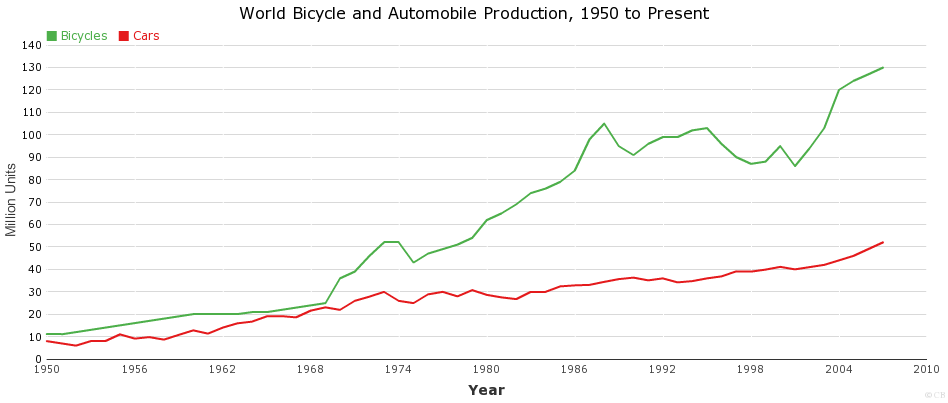
| Year | Bicycles in Million Units | Cars in Million Units | Number of Bicycles for Every Automobile |
| 2007 | 130 | 52.00 | 2.50 |
| 2006 | 127 | 49.00 | 2.59 |
| 2005 | 124 | 46.00 | 2.70 |
| 2004 | 120 | 44.00 | 2.73 |
| 2003 | 103 | 42.00 | 2.45 |
| 2002 | 94 | 41.00 | 2.29 |
| 2001 | 86 | 40.00 | 2.15 |
| 2000 | 95 | 41.10 | 2.31 |
| 1999 | 88 | 39.90 | 2.21 |
| 1998 | 87 | 39.00 | 2.23 |
| 1997 | 90 | 39.10 | 2.30 |
| 1996 | 96 | 36.90 | 2.60 |
| 1995 | 103 | 36.00 | 2.86 |
| 1994 | 102 | 34.80 | 2.93 |
| 1993 | 99 | 34.20 | 2.89 |
| 1992 | 99 | 36.00 | 2.75 |
| 1991 | 96 | 35.10 | 2.74 |
| 1990 | 91 | 36.30 | 2.51 |
| 1989 | 95 | 35.70 | 2.66 |
| 1988 | 105 | 34.40 | 3.05 |
| 1987 | 98 | 33.10 | 2.96 |
| 1986 | 84 | 32.90 | 2.55 |
| 1985 | 79 | 32.40 | 2.44 |
| 1984 | 76 | 30.00 | 2.53 |
| 1983 | 74 | 30.00 | 2.47 |
| 1982 | 69 | 26.70 | 2.58 |
| 1981 | 65 | 27.50 | 2.36 |
| 1980 | 62 | 28.60 | 2.17 |
| 1979 | 54 | 30.80 | 1.75 |
| 1978 | 51 | 28.00 | 1.82 |
| 1977 | 49 | 30.00 | 1.63 |
| 1976 | 47 | 28.90 | 1.63 |
| 1975 | 43 | 25.00 | 1.72 |
| 1974 | 52 | 26.00 | 2.00 |
| 1973 | 52 | 30.00 | 1.73 |
| 1972 | 46 | 27.90 | 1.65 |
| 1971 | 39 | 26.00 | 1.50 |
| 1970 | 36 | 22.00 | 1.64 |
| 1969 | 25 | 23.10 | 1.08 |
| 1968 | 24 | 21.60 | 1.11 |
| 1967 | 23 | 18.60 | 1.24 |
| 1966 | 22 | 19.20 | 1.15 |
| 1965 | 21 | 19.00 | 1.11 |
| 1964 | 21 | 16.70 | 1.26 |
| 1963 | 20 | 15.90 | 1.26 |
| 1962 | 20 | 14.00 | 1.43 |
| 1961 | 20 | 11.40 | 1.75 |
| 1960 | 20 | 12.80 | 1.56 |
| 1959 | 19 | 10.80 | 1.76 |
| 1958 | 18 | 8.70 | 2.07 |
| 1957 | 17 | 9.80 | 1.73 |
| 1956 | 16 | 9.10 | 1.76 |
| 1955 | 15 | 11.00 | 1.36 |
| 1954 | 14 | 8.00 | 1.75 |
| 1953 | 13 | 8.00 | 1.63 |
| 1952 | 12 | 6.00 | 2.00 |
| 1951 | 11 | 7.00 | 1.57 |
| 1950 | 11 | 8.00 | 1.38 |
| No Results | |||
| Filter : | Loading... |
