-
Environment
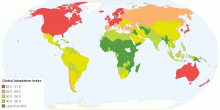
Global Adaptation Index
This chart shows the Notre Dame Global Adaptation Index by Country. The ND-GAIN Index is a navigation tool that helps corporate and development leaders manage r ...3.18 rating | 9,958 views | Discuss this10 years ago -
Environment
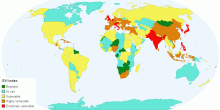
Environmental Vulnerability Index (EVI)
This chart shows the Environmental Vulnerability Index (EVI) by Country. The Environmental Vulnerability Index (EVI) is a measurement devised by the South Pacif ...3.88 rating | 12,693 views | Discuss this10 years ago -
Environment
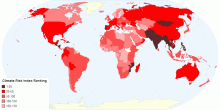
Global Climate Risk Index
This chart shows the Global Climate Risk Index. The Global Climate Risk Index analyses to what extent countries have been affected by the impacts of weather-rel ...4.52 rating | 14,204 views | Discuss this10 years ago -
Environment
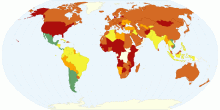
Happy Planet Index (HPI)
This map shows the overall scores from the second global compilation of the Happy Planet Index (HPI). The HPI is an index of human well-being and environmental i ...3.77 rating | 8,442 views | Discuss this10 years ago -
Environment
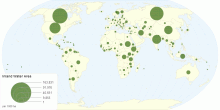
Inland Water Area by Country
This chart shows inland water area details by country. Inland waters are permanent water bodies inland from the coastal zone and areas whose properties and use ...4.27 rating | 11,952 views | Discuss this11 years ago -
Environment
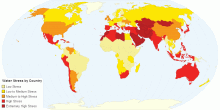
Water Stress by Country
This Map shows the average exposure of water users in each country to water stress. Most water-related decisions are made across political or administra ...4.19 rating | 15,467 views | Discuss this11 years ago -
Environment
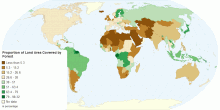
Proportion of Land Area Covered by Forest
This map shows proportion of forest area to total land area (expressed as a percentage). Forest is defined in the Food and Agriculture Organization’s (FAO ...4.32 rating | 72,698 views | 2 Comments14 years ago -
Environment
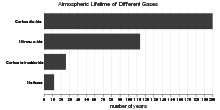
Atmospheric Lifetime of Different Greenhouse Gases
This chart shows atmospheric lifetime of different greenhouse gases. What is atmospheric lifetime? The lifetime of a greenhouse gas refers to the approximate a ...4.25 rating | 54,356 views | 3 Comments14 years ago -
Environment
Global Carbon Dioxide Emissions
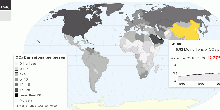
This maps shows current worldwide carbon dioxide(CO₂) emissions and per capita emissions from the consumption of energy. Data includes emissions due to the con ...4.69 rating | 39,155 views | 1 Comment15 years ago -
Environment
Total Renewable Water Resources Dependency Ratio by Country
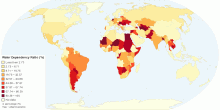
This map shows the percent of total renewable water resources dependency ratio or originating outside the country. What is Dependency ratio? Dependency ratio m ...4.81 rating | 33,927 views | 2 Comments15 years ago -
Environment
National Rainfall Index (NRI)
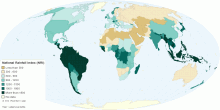
This map shows national rainfall index (NRI). Waht is National Rainfall Index (NRI)? A national rainfall index (NRI) is defined as the national average of the ...4.62 rating | 37,927 views | Discuss this15 years ago -
Environment
Worldwide Cooling Needs
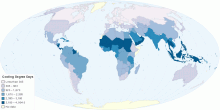
This map shows worldwide cooling degree days. Cooling degree day (HDD) is a measurement designed to reflect the demand for energy needed to cool a home or busine ...4.64 rating | 22,222 views | 2 Comments15 years ago -
Environment
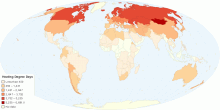
Worldwide Heating Needs
This map shows worldwide heating degree days. Heating degree day (HDD) is a measurement designed to reflect the demand for energy needed to heat a home or busine ...4.30 rating | 24,839 views | 2 Comments15 years ago -
Environment
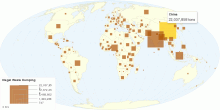
Global Illegal Waste Dumping by Country
This map shows an estimate of illegal waste dumping (in forests, public areas and elsewhere) lying around in the world by country (in tons). Total World illegal ...4.76 rating | 33,384 views | 5 Comments15 years ago -
Environment
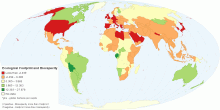
Ecological Footprint of Consumption Compared to Biocapacity
This map compares each country's total consumption Footprint with the biocapacity available within its own borders. Many countries rely, in net terms, on th ...4.16 rating | 87,883 views | 4 Comments15 years ago
