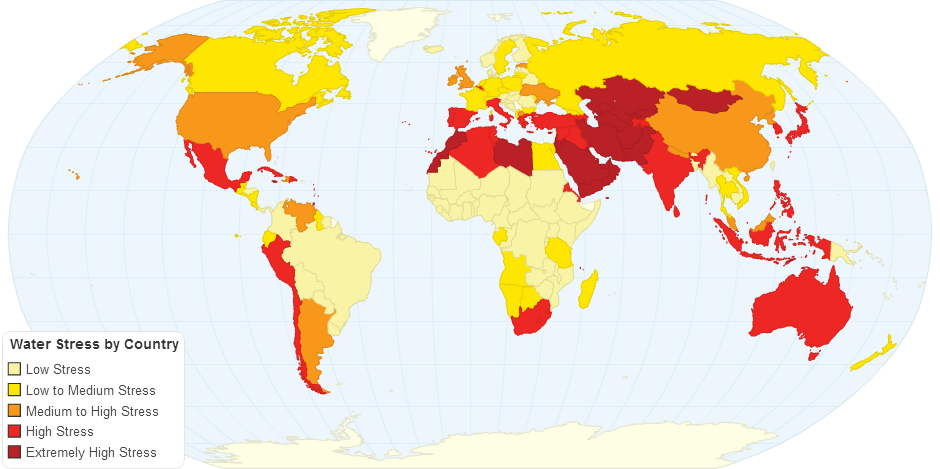
This Map shows the average exposure of water users in each country to water stress.
Most water-related decisions are made across political or administrative boundaries, creating a demand for simple and robust water information to support decision making at the administrative level. Governments devise policies to manage water resources within their borders, and can use country indicators as a statistic against which to benchmark themselves. Many financial institutions divide their portfolios by country, and thus require national-level water data to evaluate portfolio exposure to water-related risks.
These global rankings enable comparison among countries and major river basins. The selected indicators make that possible by providing a clear, objective measure of underlying natural factors that drive water-quantity related risks. These rankings, therefore, do not incorporate more subjective factors like the effect of water governance, investment, or conservation efforts focusing on water availability. WRI’s estimates show the average level of exposure to five of Aqueduct’s physical water quantity risk indicators for countries and major river basins worldwide.
These indicators include:
- Baseline water stress: the ratio of total annual water withdrawals to total available annual renewable supply.
- Inter-annual variability: the variation in water supply between years.
- Seasonal variability: the variation in water supply between months of the year.
- Flood occurrence: the number of floods recorded from 1985 to 2011.
- Drought severity: the average length of droughts times the dryness of the droughts from 1901 to 2008.
This paper details the methodology used for the weighted aggregations and provides basic interpretive guidelines for the resulting country and river basin-level indicators.
11 years ago

