-
Country Info
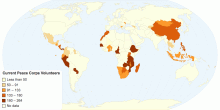
Current Peace Corps Volunteers by Country
Data retrieved from peacecorps.gov1.00 rating | 3,327 views | Discuss this11 years ago -
Food & Agriculture
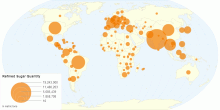
Refined Sugar Quantity by Country
This chart shows refined sugar quantity by country. Refined sugar is made from raw sugar that has undergone a refining process to remove the molasses. Raw sugar ...5.00 rating | 3,979 views | Discuss this11 years ago -
Energy
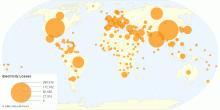
Electricity Losses by Country
This chart shows electricity losses by country in 2012. Electric power transmission is the bulk transfer of electrical energy, from generating power plants to e ...2.33 rating | 5,209 views | Discuss this11 years ago -
Population
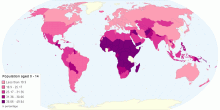
Percentage of Population Aged 0 - 14 by Country
This chart shows percentage of population aged 0 - 14 by country in 2015. A population is a summation of all the organisms of the same group or species, which l ...5.00 rating | 5,013 views | Discuss this11 years ago -
Others
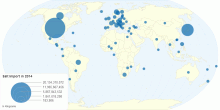
Salt Import Quantity by Country
This chart shows Salt(sodium chloride) including solution, salt water in 2014 by country. Common salt is a mineral composed primarily of sodium chloride (N ...5.00 rating | 4,054 views | Discuss this11 years ago -
Others
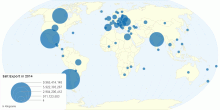
Salt Export Quantity by Country
This chart shows Salt(sodium chloride) including solution, salt water in 2014 by country. Common salt is a mineral composed primarily of sodium chloride (N ...0.00 rating | 2,052 views | Discuss this11 years ago -
Work
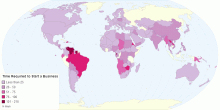
Time Required to Start a Business by Country
This chart shows the time required to start a business (days) by country in 2013. Time required to start a business is the number of calendar days needed to com ...0.00 rating | 5,632 views | Discuss this11 years ago -
Others
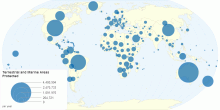
Terrestrial and Marine Areas Protected by Country
This chart shows terrestrial and marine areas protected by country. Terrestrial protected areas are totally or partially protected areas of at least 1,000 hecta ...5.00 rating | 6,330 views | Discuss this11 years ago -
Others
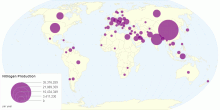
Nitrogen Production In Nutrients
This chart shows nitrogen production in nutrients details by country. Nitrogen is a chemical element with symbol N and atomic number 7. It is the lighte ...3.00 rating | 4,524 views | Discuss this11 years ago -
People
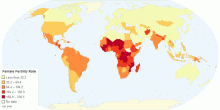
Female (15-19 Years) Fertility Rate By Country
This charts shows female (15-19) years fertility rate details by country. Fertility rate represents the number of children that would be born to a woman if she ...4.50 rating | 8,197 views | Discuss this11 years ago -
Others
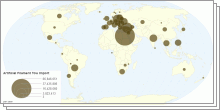
Artificial Filament Tow Import & Export
This charts shows artificial filament tow import & export quantity details by country. The opposite term is filament fibre, which is fibre that comes in con ...3.00 rating | 5,347 views | Discuss this11 years ago -
Education
Upper Secondary Education Theoretical Entry Age
This chart shows upper secondary education theoretical entry age details by country. Secondary education normally takes place in secondary schools, taking place ...3.67 rating | 8,511 views | Discuss this11 years ago -
Others
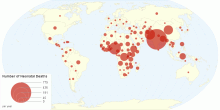
Number of Neonatal Deaths by country
This chart shows number of neonatal deaths details by country. A neonate is also called a newborn. The neonatal period -- the first 4 weeks of a child's lif ...5.00 rating | 4,395 views | Discuss this11 years ago -
Education
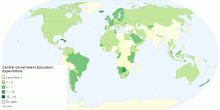
Central Government Allocated Expenditure For Education
This charts shows central government allocated education expenditure details by country. General government expenditure on education (current, capital, and tran ...4.43 rating | 9,545 views | Discuss this11 years ago -
Others
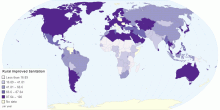
Rural Improved Sanitation Facilities of Population ...
This chart shows rural improved sanitation facilities of population details by country. The improved sanitation facilities include flush/pour flush (to ...3.00 rating | 4,342 views | Discuss this11 years ago