-
Food & Agriculture
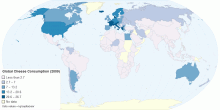
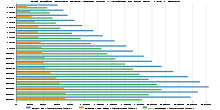
Global Cheese Consumption 2009
Interactive map of 2009 cheese consumption levels from a global perspective. The map displays consumption values measured in kg/per person/year. Data was compil ...4.64 rating | 14,026 views | 1 Comment12 years ago -
Country Info
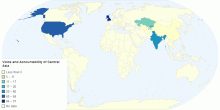
Voice and Accountability of Central Asia in 2009
A map of WGI's Voice and Accountability Index for Central Asia in 2009 with comparisons to major powers on the region (China and India) as well as other worl ...5.00 rating | 1,604 views | Discuss this12 years ago -
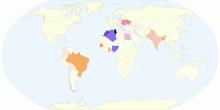
Food & Agriculture
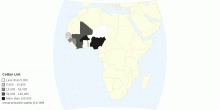
Production Quantity of Cotton Lint
Production of cotton lint for West Africa in 2009 according to FAOSTAT0.00 rating | 840 views | Discuss this9 years ago -
Economic
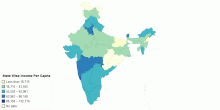
State Wise Income Per Capita
chart created from data copied from http://www.onemint.com/2011/08/10/india-per-capita-income-2010-by-state/?utm_source=feedburner&utm_medium=feed&u ...4.68 rating | 7,704 views | Discuss this15 years ago -
Infrastructure
Pet Bottle Sales Recycling and Wasting in the Us 1991 2009
PET Bottle Sales, Recycling and Wasting in the U.S (1991-2009)5.00 rating | 2,558 views | Discuss this15 years ago -
Country Info
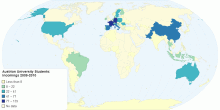
Austrian University Students Incomings 2009 2010
International Mobility at Austrian Universities. The map shows where external students (incomings) come from, who did an exchange semester at an Austrian Univer ...0.00 rating | 3,326 views | Discuss this13 years ago -
Food & Agriculture
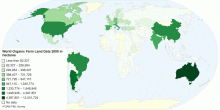
World Organic Farm Land Data 2005 2009 Ifoam FiBL Survey
The World of Organic Agriculture 20115.00 rating | 6,967 views | Discuss this14 years ago -
Food & Agriculture
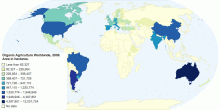
Organic Agriculture Area Worldwide, 2009. IFOAM-FiBL Survey
Organic Agriculture Area, 2009. IFOAM-FiBL Survey. Area in hectares.5.00 rating | 6,034 views | 2 Comments14 years ago -
Immigration
Origine degli immigrati in Italia nel 2009
This chart shows the country origins of the Italian immigration flow in 2009.4.00 rating | 14,985 views | 2 Comments13 years ago