-
Environment
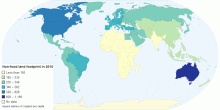
Non-food land footprint in 2010
The land required per capita of each country to satisfy final demand for bio-based non-food products such as textiles, biofuels or bio-polymers.0.00 rating | 1,404 views | Discuss this9 years ago -
Environment
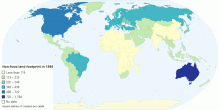
Non-food land footprint in 1995
Cropland required per capita of each country in 1995 to satisfy final demand for non-food commodities0.00 rating | 1,288 views | Discuss this9 years ago -
Country Info
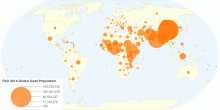
FAO 2014 Global Goat Population
FAO 2014 Global Goat Population4.33 rating | 4,183 views | Discuss this10 years ago -
Country Info
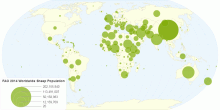
FAO Statistic 2014 Global Sheep Population
FAO Statistic 2014 Global Sheep Population5.00 rating | 4,945 views | Discuss this10 years ago -
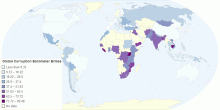
Country Info
Global Corruption Barometer Bribes
Global Corruption Barometer Bribes0.00 rating | 2,684 views | Discuss this11 years ago -
Education
World Oil Production Since 1950
Chart showing an increase in world oil production. Oil production indicates the increase in demand and thereby the consumption of oil . And therefore indicates a ...3.67 rating | 2,411 views | Discuss this12 years ago -
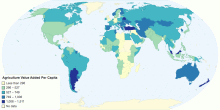
Food & Agriculture
Agriculture Value Added Per Capita
Ag VA per Capita Worldwide in 2005 PPP $5.00 rating | 1,874 views | Discuss this12 years ago -
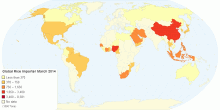
Economic
Global Rice Importer March 2014 (1000 Tons)
Global rice statistics, import countries in March 20140.00 rating | 3,465 views | Discuss this12 years ago -
Economic
Global Rice Importer March 2013 1000 Tons
Global rice statistics, import countries in March 20131.00 rating | 3,522 views | Discuss this12 years ago -
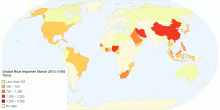
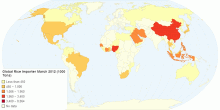
Economic
Global Rice Importer March 2012 1000 Tons
Global rice statistics, import countries in March 20120.00 rating | 3,375 views | Discuss this12 years ago -
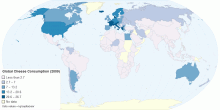
Food & Agriculture
Global Cheese Consumption 2009
Interactive map of 2009 cheese consumption levels from a global perspective. The map displays consumption values measured in kg/per person/year. Data was compil ...4.64 rating | 14,016 views | 1 Comment12 years ago -
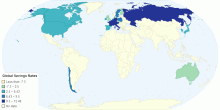
Economic
Global Savings Rates
A map of average savings rates. Data from the US Census Bureau (http://www.census.gov/compendia/statab/2012/tables/12s1363.pdf) Dates are 1995,200,2002-20085.00 rating | 3,498 views | Discuss this12 years ago -
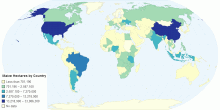
Country Info
2011 Harvested Maize Hectares by Country
Map showing maize hectares by country5.00 rating | 3,524 views | Discuss this13 years ago -
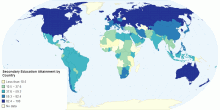
Education
Secondary Education Attainment by Country
Secondary Education Attainment by Country, as a percent of adult population in 20103.00 rating | 5,985 views | Discuss this13 years ago -
Country Info
Forest Area From: Anthony Bai 12D
Geography project1.00 rating | 3,220 views | Discuss this13 years ago