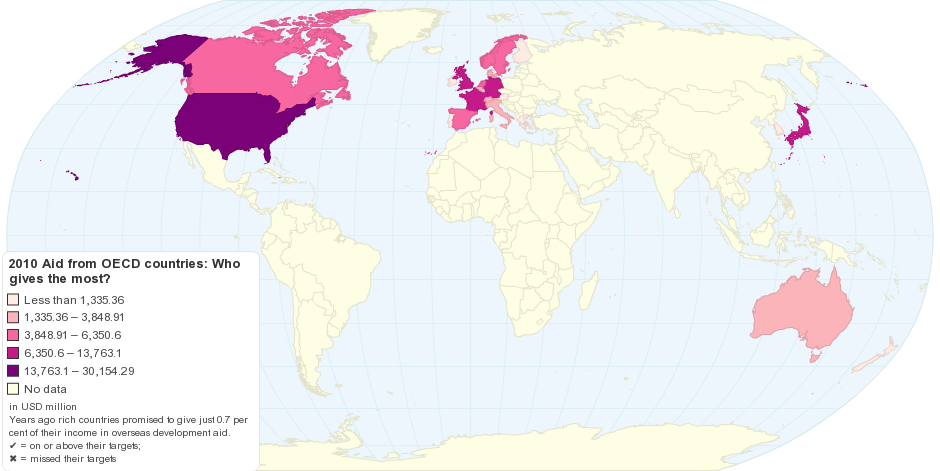
This map shows 2010 Official Development Assistance by OECD member countries. 41 years ago (in 1969) rich countries promised to give 0.7 per cent of their income in overseas development aid, yet today only five countries do this.
New figures released by the the Organization for Economic Co-operation and Development (OECD) published in Guardian News, show an $19 billion shortfall, but it is adjusted down to $18 billion take account of the economic recession.
- Total 2010 Aid: US $128,728.34 Million
- ODA/GNI: 0.32% GNI
- Average Country Effort: 0.49% GNI
- Total 2010 aid at 2009 exchange rates: 127,518.17 Million
- Total 2009 aid: 119,780.95 Million
- % change 2009 - 2010: 6.46%
Some highlights (Guardian 2011):
- Net aid flows from OECD donor countries totalled a record $128.7bn in 2010. This represents close to 0.32% of the countries' collective GNI, and an overall increase of 6.5% from 2009
- The largest donors of development aid in 2010 were the US, the UK, France, Germany and Japan
- The US remains the biggest spender with a total of $30.2bn, the largest aid disbursement ever recorded by a single donor. But proportional to the US gross national income, aid remained unchanged at 0.21%
- Australia, Belgium, Canada, Japan, Korea, Portugal and the UK registered the largest increases in aid volumes between 2009 and 2010
- Portugal led the way, increasing its aid spend by 31.5%
- Specific initiatives to scale up aid programmes in the UK and Korea led to increases of 19.4% and 25.7%, respectively
- Budgetary pressures and fiscal constraints contributed to reduced aid spending in Greece, Ireland, and Spain
It would cost $16bn each year to ensure every child in poor countries gets the chance to go to school by 2015. The average annual salary of a nurse or midwife in Sub-Saharan African is $2500. The average cost of a mosquito net is $3.60 (Oxfam 2011).
According to the Stockholm International Peace Research Institution the total global military expenditure in 2009 is estimated to have been $1,531 billion.
15 years ago
