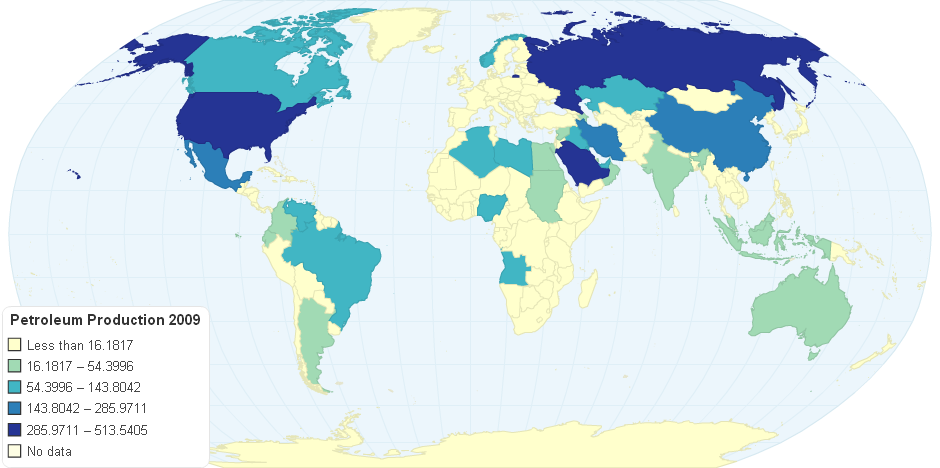
Petroleum Production 2009
Do you like this chart?
✔ Yes
✖
✚ Share
References and Data Table
HTML Embed code
$ Buy Now
1,685 views
- Add new comment

Technotrade Worldwide Product Spread
5.00 rating | 2,872 views | 0 comments
Energy Use, Per Capita
0.00 rating | 2,845 views | 0 comments
Energy use per capita
0.00 rating | 2,676 views | 0 comments
Coal Years Left 1995
0.00 rating | 3,648 views | 0 comments