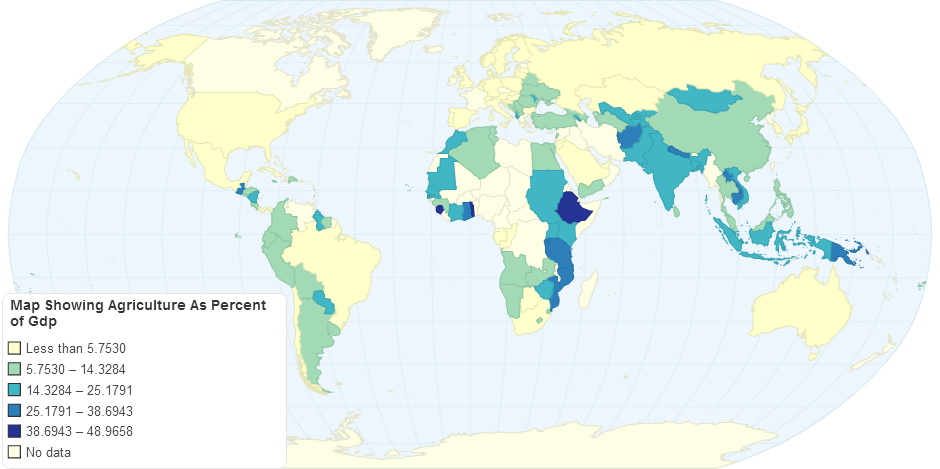
Map Showing Agriculture As Percentage of Gdp
Do you like this chart?
✔ Yes
✖
✚ Share
References and Data Table
HTML Embed code
$ Buy Now
1,393 views
- Add new comment

World Organic Farm Land Data 2005 2009 Ifoam FiBL Survey
5.00 rating | 6,955 views | 0 comments
Organic Agriculture Area Worldwide, 2009. IFOAM-FiBL Survey
5.00 rating | 6,025 views | 2 comments
Countries with the largest number of Organic Certif ...
5.00 rating | 4,121 views | 0 comments
Agricultural Land of Land Area
4.50 rating | 2,732 views | 0 comments