Register to create your own interactive chart
|
Login »
Search
All
Country info
Drugs & Crime
Environment
Economic
Food & Agriculture
Health
Social
Society
More ▼
Education
Energy
Immigration
Infrastructure
Information & Communication Technology
People
Population
Religion
Sports
Tourism
Work
Others
Get free updates by Email
Get Email Updates!
Report an error
Follow us...
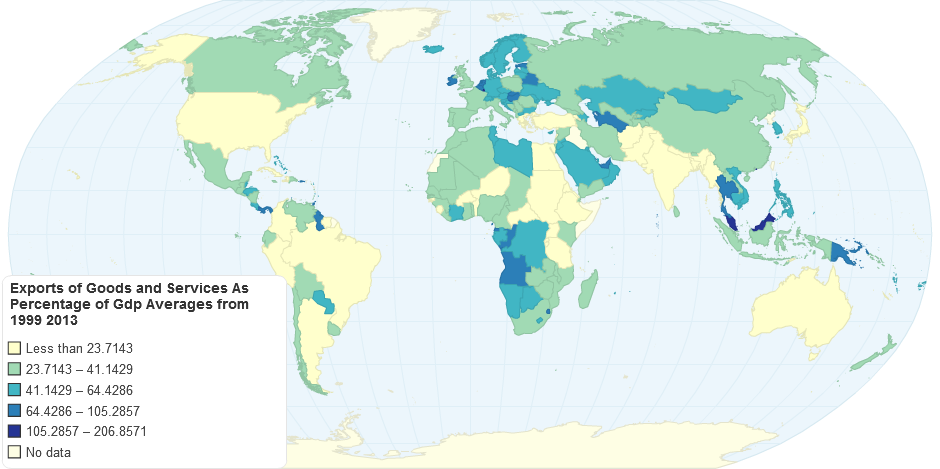
Exports of Goods and Services As Percentage of GDP Averages from 1999 2013
Hello, you have JavaScript turned off. Please enable JavaScript to see this interactive data visualization.
Do you like this chart?
✔ Yes
✖
✚ Share
References and Data Table
HTML Embed code
$ Buy Now
3,846
views
Tweet
Econ 322
Last updated:
12 years ago
Category:
Economic
Tags:
Exports of Goods and Services As Percentage of GDP Averages from 1999 2013
References
Embed or download
Source
Exports of Goods and Services as Percentage of GDP: Averages from 1999-2013
, World Bank, viewed 10th February, 2014.
Citation
Exports of Goods and Services As Percentage of GDP Averages from 1999 2013
, ChartsBin.com, viewed 1st August, 2026, <http://chartsbin.com/view/21455>.
Read more »
Add new comment
Respond to this visualizations...
Loading...
Click here to view the discussion thread.
Related charts / graphs
Total Debt Service of Exports of Goods Services and ...
0.00 rating | 2,621 views | 0 comments
Total Debt Service of Exports of Goods Services and ...
0.00 rating | 3,326 views | 0 comments
List of Countries by Exports
3.52 rating | 22,502 views | 2 comments
List of Countries by Exports per capita
2.96 rating | 27,728 views | 0 comments
You Might Also Like Our Friends' Posts
Copyright 2011 ChartsBin.com. All rights reserved.
About
|
Chat
|
Contact
|
Sign Up
|
Privacy
|
Legal
|
Feedback