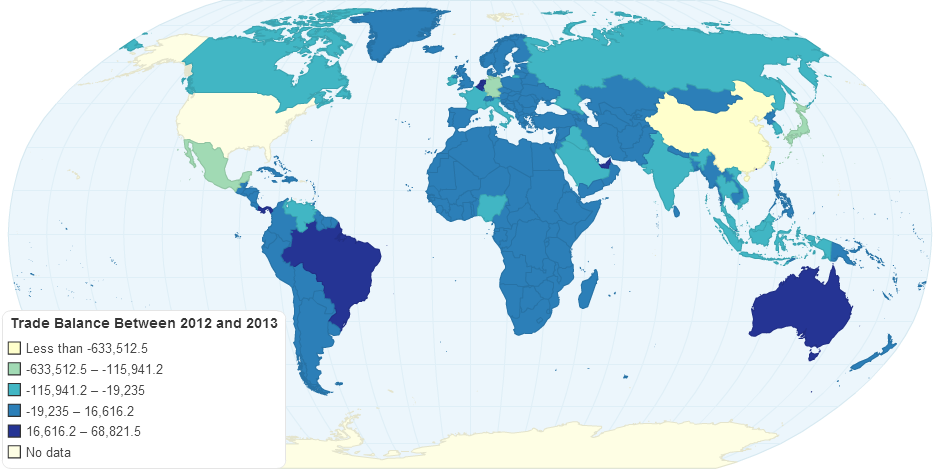
Trade Balance Between 2012 and 2013
Do you like this chart?
✔ Yes
✖
✚ Share
References and Data Table
HTML Embed code
$ Buy Now
1,826 views
- Add new comment

Average Truckload Expense by State
0.00 rating | 1,829 views | 0 comments
GDP Per Capita
0.00 rating | 2,461 views | 0 comments
123
0.00 rating | 2,040 views | 0 comments
GDP Per Capita
0.00 rating | 2,141 views | 0 comments