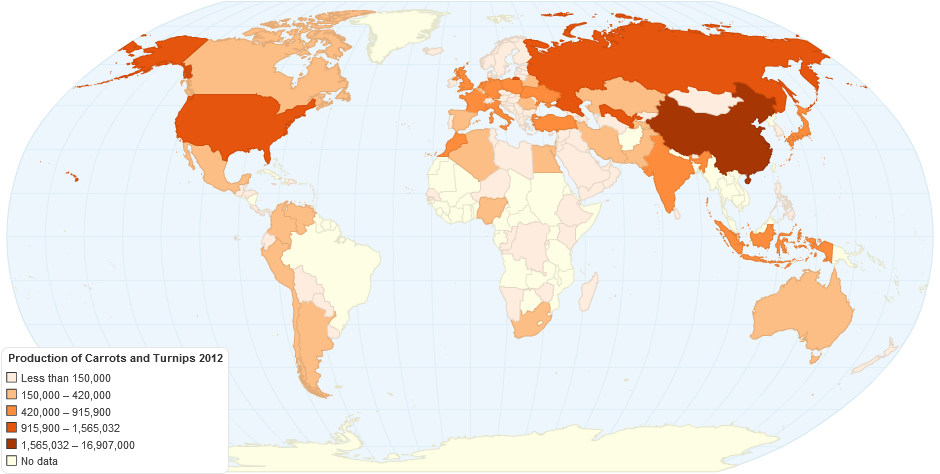
Production of Carrots and Turnips 2012
Do you like this chart?
✔ Yes
✖
✚ Share
References and Data Table
HTML Embed code
$ Buy Now
1,513 views
- Add new comment

Produkce mrkve a tuřínů
0.00 rating | 1,190 views | 0 comments
Produkce mrkve ve světě
0.00 rating | 994 views | 0 comments
Produkce mrkve ve světě v roce 2013
0.00 rating | 2,631 views | 0 comments
Carrots and Turnips Yield by Country
3.00 rating | 5,759 views | 0 comments