Register to create your own interactive chart
|
Login »
Search
All
Country info
Drugs & Crime
Environment
Economic
Food & Agriculture
Health
Social
Society
More ▼
Education
Energy
Immigration
Infrastructure
Information & Communication Technology
People
Population
Religion
Sports
Tourism
Work
Others
Get free updates by Email
Get Email Updates!
Report an error
Follow us...
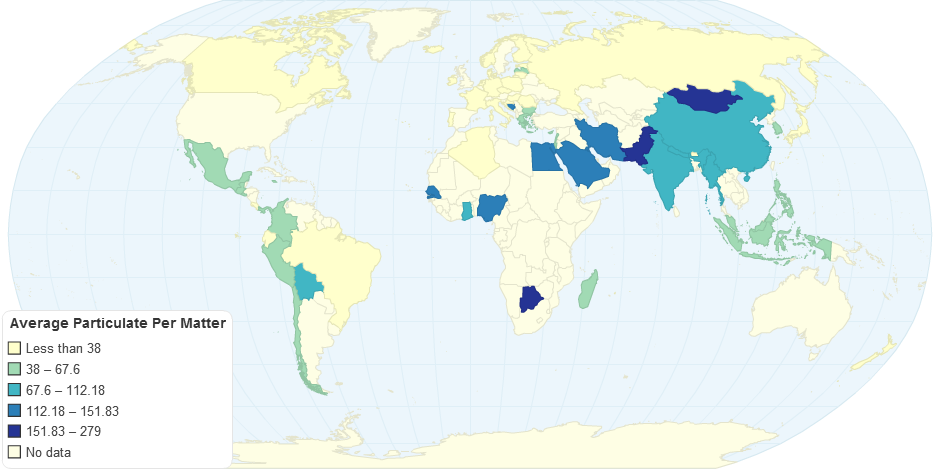
Average Particulate Per Matter
Hello, you have JavaScript turned off. Please enable JavaScript to see this interactive data visualization.
Do you like this chart?
✔ Yes
✖
✚ Share
References and Data Table
HTML Embed code
$ Buy Now
1,938
views
Tweet
This map provides us with the average particulate matter in india.
Last updated:
12 years ago
Category:
Environment
Tags:
WHO
India
References
Embed or download
Source
Average particulate per matter
, WHO, viewed 7th October, 2014.
Citation
Average Particulate Per Matter
, ChartsBin.com, viewed 31st May, 2026, <http://chartsbin.com/view/28022>.
Read more »
Add new comment
Respond to this visualizations...
Loading...
Click here to view the discussion thread.
Related charts / graphs
Air quality with respect to Suspended Particulate Matter
0.00 rating | 2,104 views | 0 comments
Forest Area Cover of India (as per-centage of gross area)
5.00 rating | 3,049 views | 0 comments
Illegal Dump Yards
0.00 rating | 1,993 views | 0 comments
World Pollution Data
0.00 rating | 2,038 views | 0 comments
You Might Also Like Our Friends' Posts
Copyright 2011 ChartsBin.com. All rights reserved.
About
|
Chat
|
Contact
|
Sign Up
|
Privacy
|
Legal
|
Feedback