Register to create your own interactive chart
|
Login »
Search
All
Country info
Drugs & Crime
Environment
Economic
Food & Agriculture
Health
Social
Society
More ▼
Education
Energy
Immigration
Infrastructure
Information & Communication Technology
People
Population
Religion
Sports
Tourism
Work
Others
Get free updates by Email
Get Email Updates!
Report an error
Follow us...
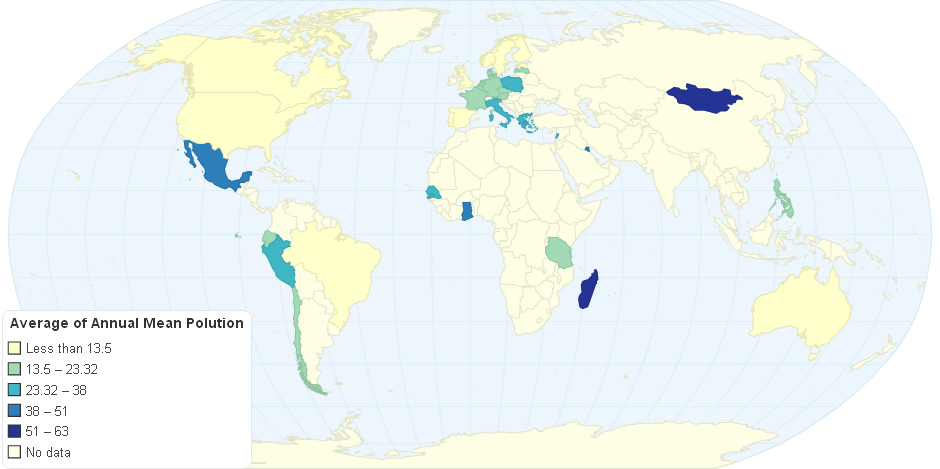
Average Annual Pollution
Hello, you have JavaScript turned off. Please enable JavaScript to see this interactive data visualization.
Do you like this chart?
✔ Yes
✖
✚ Share
References and Data Table
HTML Embed code
$ Buy Now
1,118
views
Tweet
Data visualizing the pollution by the countries across the world
Last updated:
12 years ago
Category:
Environment
Tags:
pollution
countries
References
Embed or download
Source
Average of Annual Mean Polution
, WHO, viewed 15th October, 2014.
Citation
Average Annual Pollution
, ChartsBin.com, viewed 11th June, 2026, <http://chartsbin.com/view/28048>.
Read more »
Add new comment
Respond to this visualizations...
Loading...
Click here to view the discussion thread.
Related charts / graphs
Average of Annual Mean Polution
0.00 rating | 2,913 views | 0 comments
Pollution Data
0.00 rating | 2,688 views | 0 comments
Econ 322 Freshwater Pollution Levels
5.00 rating | 3,897 views | 0 comments
Pollution
3.67 rating | 3,259 views | 0 comments
You Might Also Like Our Friends' Posts
Copyright 2011 ChartsBin.com. All rights reserved.
About
|
Chat
|
Contact
|
Sign Up
|
Privacy
|
Legal
|
Feedback