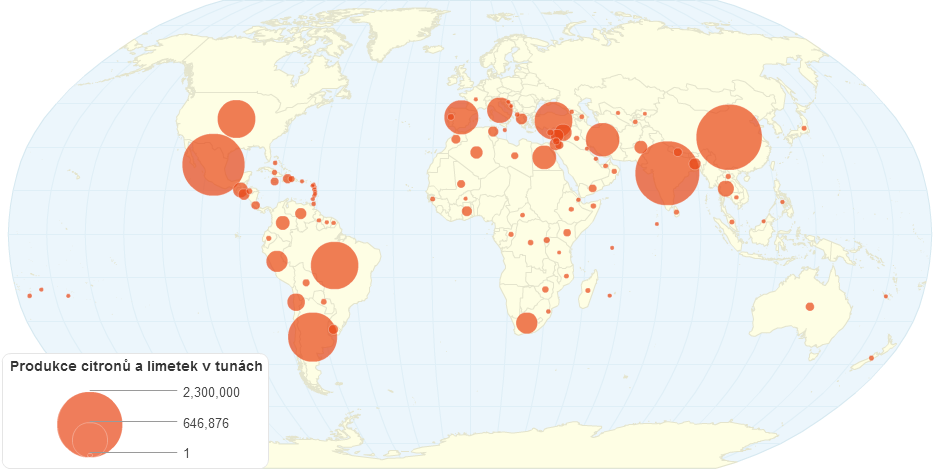
Lemons and Limes Production Quantity in 2012
Do you like this chart?
✔ Yes
✖
✚ Share
References and Data Table
HTML Embed code
$ Buy Now
1,873 views
- Add new comment

Produkce Mrkve Ve Svt V Roce 2012
0.00 rating | 2,083 views | 0 comments
Produkce čajovníku v roce 2012
5.00 rating | 2,174 views | 0 comments
Produkce dobytka ve světě roku 2014
0.00 rating | 1,231 views | 0 comments
Pěstování vlašských ořechů v Evropě, 2013
0.00 rating | 1,352 views | 0 comments