Register to create your own interactive chart
|
Login »
Search
All
Country info
Drugs & Crime
Environment
Economic
Food & Agriculture
Health
Social
Society
More ▼
Education
Energy
Immigration
Infrastructure
Information & Communication Technology
People
Population
Religion
Sports
Tourism
Work
Others
Get free updates by Email
Get Email Updates!
Report an error
Follow us...
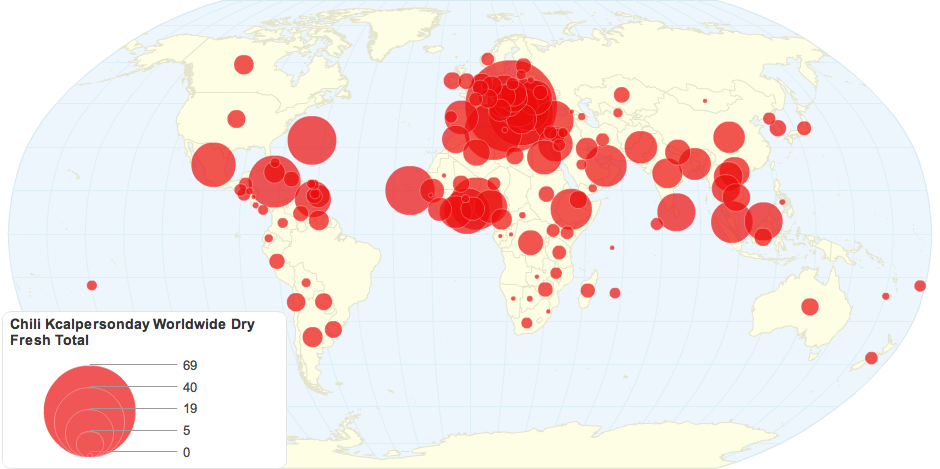
Chili Kcalpersonday Worldwide Dry Fresh Total
Hello, you have JavaScript turned off. Please enable JavaScript to see this interactive data visualization.
Do you like this chart?
✔ Yes
✖
✚ Share
References and Data Table
HTML Embed code
$ Buy Now
1,603
views
Tweet
Map to represent total consumption daily of dry and fresh chilies
Last updated:
14 years ago
Category:
Food & Agriculture
Tags:
food
2003
References
Embed or download
Source
Chili KCal/Person/Day Worldwide Dry, Fresh, Total
, FAO, viewed 17th October, 2011.
Citation
Chili Kcalpersonday Worldwide Dry Fresh Total
, ChartsBin.com, viewed 3rd April, 2026, <http://chartsbin.com/view/3365>.
Read more »
Add new comment
Respond to this visualizations...
Loading...
Click here to view the discussion thread.
Related charts / graphs
Food Insecurity in the African Continent
1.00 rating | 4,880 views | 0 comments
Food Hubs in the U.S.
1.00 rating | 4,313 views | 0 comments
Chili Kcal/person/day Worldwide Dry Fresh Total
3.00 rating | 2,619 views | 0 comments
How Much Water is Needed to Produce Your Meal?
4.62 rating | 9,341 views | 2 comments
You Might Also Like Our Friends' Posts
Copyright 2011 ChartsBin.com. All rights reserved.
About
|
Chat
|
Contact
|
Sign Up
|
Privacy
|
Legal
|
Feedback