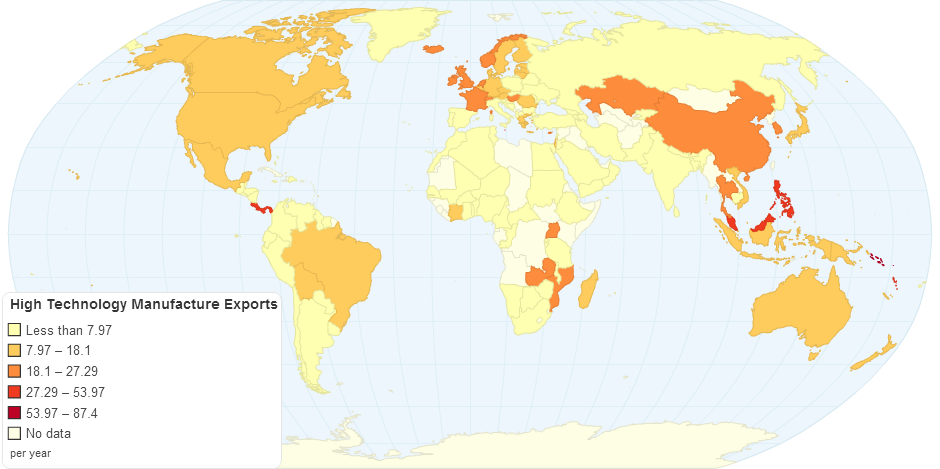
This chart shows high technology manufacture exports details by country.
High-technology exports are products with high R&D intensity, such as in aerospace, computers, pharmaceuticals, scientific instruments, and electrical machinery.
11 years ago
| Country | Value |
|---|---|
| Albania | 0.53 |
| Algeria | 0.16 |
| Antigua and Barbuda | 0 |
| Argentina | 7.48 |
| Armenia | 2.6 |
| Aruba | 4.1 |
| Australia | 13.1 |
| Austria | 11.67 |
| Azerbaijan | 1.35 |
| Bahamas | 0 |
| Bahrain | 0.15 |
| Bangladesh | 0.17 |
| Barbados | 13.69 |
| Belarus | 2.57 |
| Belgium | 10.0 |
| Belize | 4.84 |
| Benin | 0.43 |
| Bhutan | 0 |
| Bolivia | 13.27 |
| Bosnia and Herzegovina | 3.0 |
| Botswana | 0.87 |
| Brazil | 9.72 |
| Bulgaria | 7.47 |
| Burkina Faso | 5.9 |
| Burundi | 0 |
| Cambodia | 0.1 |
| Cameroon | 5.9 |
| Canada | 13.43 |
| Cape Verde | 0.6 |
| Central African Republic | 0.0 |
| Chile | 4.61 |
| China | 25.81 |
| Colombia | 4.33 |
| Congo, Rep. | 2.56 |
| Costa Rica | 40.84 |
| Cote d'Ivoire | 15.1 |
| Croatia | 7.56 |
| Cyprus | 27.29 |
| Czech Republic | 16.28 |
| Denmark | 13.76 |
| Dominican Republic | 2.23 |
| East Asia & Pacific (all income levels) | 24.19 |
| East Asia & Pacific (developing only) | 25.64 |
| Ecuador | 3.23 |
| Egypt, Arab Rep. | 0.95 |
| El Salvador | 5.59 |
| Estonia | 13.39 |
| Ethiopia | 2.0 |
| Euro area | 14.45 |
| Europe & Central Asia (all income levels) | 14.63 |
| Europe & Central Asia (developing only) | 9.83 |
| European Union | 14.95 |
| Fiji | 3.54 |
| Finland | 9.27 |
| France | 23.75 |
| French Polynesia | 15.8 |
| Gambia, The | 4.24 |
| Georgia | 1.34 |
| Germany | 14.96 |
| Ghana | 1.4 |
| Greece | 9.66 |
| Greenland | 2.4 |
| Guatemala | 4.43 |
| Guyana | 0.13 |
| Heavily indebted poor countries (HIPC) | 7.52 |
| High income | 16.35 |
| High income: nonOECD | 16.1 |
| High income: OECD | 16.41 |
| Honduras | 1.63 |
| Hong Kong SAR, China | 13.71 |
| Hungary | 22.73 |
| Iceland | 20.86 |
| India | 6.87 |
| Indonesia | 8.33 |
| Iran, Islamic Rep. | 4.12 |
| Ireland | 21.71 |
| Israel | 13.98 |
| Italy | 7.37 |
| Jamaica | 0.64 |
| Japan | 17.46 |
| Jordan | 2.51 |
| Kazakhstan | 24.67 |
| Korea, Rep. | 25.72 |
| Kyrgyz Republic | 3.0 |
| Latin America & Caribbean (all income levels) | 10.64 |
| Latin America & Caribbean (developing only) | 11.26 |
| Latvia | 8.24 |
| Lebanon | 2.38 |
| Lithuania | 10.21 |
| Low & middle income | 17.16 |
| Low income | 4.1 |
| Lower middle income | 8.72 |
| Luxembourg | 8.81 |
| Macao SAR, China | 0 |
| Macedonia, FYR | 3.91 |
| Madagascar | 8.37 |
| Malawi | 3.18 |
| Malaysia | 43.39 |
| Mali | 3.0 |
| Malta | 47.23 |
| Mauritius | 0.8 |
| Mexico | 16.51 |
| Middle East & North Africa (developing only) | 2.21 |
| Middle income | 17.33 |
| Moldova | 6.31 |
| Morocco | 6.1 |
| Mozambique | 26.48 |
| Namibia | 1.61 |
| Nepal | 0.29 |
| Netherlands | 19.81 |
| New Caledonia | 15.38 |
| New Zealand | 9.31 |
| Nicaragua | 5.29 |
| Niger | 4.51 |
| Nigeria | 1.2 |
| North America | 17.13 |
| Norway | 18.46 |
| OECD members | 16.26 |
| Oman | 2.62 |
| Pacific island small states | 21.8 |
| Pakistan | 1.76 |
| Panama | 35.41 |
| Papua New Guinea | 14.18 |
| Paraguay | 7.3 |
| Peru | 6.22 |
| Philippines | 46.35 |
| Poland | 5.87 |
| Portugal | 3.53 |
| Qatar | 0.0 |
| Romania | 10.18 |
| Russian Federation | 7.97 |
| Rwanda | 3.36 |
| Samoa | 0.2 |
| Sao Tome and Principe | 2 |
| Saudi Arabia | 0.56 |
| Senegal | 0.56 |
| Singapore | 45.16 |
| Slovak Republic | 7.1 |
| Slovenia | 5.8 |
| Solomon Islands | 87.4 |
| South Africa | 5.0 |
| South Asia | 6.1 |
| Spain | 6.47 |
| Sri Lanka | 1.0 |
| St. Kitts and Nevis | 0.12 |
| St. Vincent and the Grenadines | 0 |
| Sub-Saharan Africa (all income levels) | 4.21 |
| Sub-Saharan Africa (developing only) | 4.21 |
| Sudan | 0.7 |
| Suriname | 6.5 |
| Sweden | 13.38 |
| Switzerland | 24.86 |
| Tanzania | 5.4 |
| Thailand | 20.74 |
| Togo | 0.21 |
| Tonga | 0.1 |
| Tunisia | 5.6 |
| Turkey | 1.84 |
| Turks and Caicos Islands | 2.1 |
| Uganda | 21.94 |
| Ukraine | 4.39 |
| United Kingdom | 21.39 |
| United States | 18.1 |
| Upper middle income | 19.86 |
| Uruguay | 6.12 |
| Vanuatu | 53.97 |
| Venezuela, RB | 2.32 |
| Vietnam | 14.49 |
| World | 16.58 |
| Yemen, Rep. | 0.32 |
| Zambia | 24.8 |
| Zimbabwe | 1.21 |
