Register to create your own interactive chart
|
Login »
Search
All
Country info
Drugs & Crime
Environment
Economic
Food & Agriculture
Health
Social
Society
More ▼
Education
Energy
Immigration
Infrastructure
Information & Communication Technology
People
Population
Religion
Sports
Tourism
Work
Others
Get free updates by Email
Get Email Updates!
Report an error
Follow us...
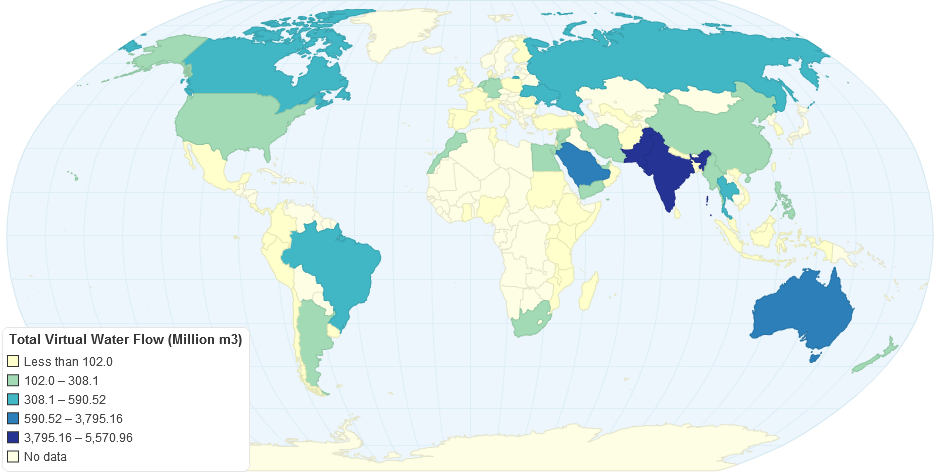
Total Virtual Water Flow in Qatar 1998 2015
Hello, you have JavaScript turned off. Please enable JavaScript to see this interactive data visualization.
Do you like this chart?
✔ Yes
✖
✚ Share
References and Data Table
HTML Embed code
$ Buy Now
1,471
views
Tweet
Total virtual water flow in Qatar between 1998 and 2015
Last updated:
10 years ago
Category:
Food & Agriculture
Tags:
Qatar
virtual water
References
Embed or download
Source
Total Virtual Water Flow in Qatar - 1998 - 2015
, Sayeed, viewed 5th February, 2016.
Citation
Total Virtual Water Flow in Qatar 1998 2015
, ChartsBin.com, viewed 22nd July, 2026, <http://chartsbin.com/view/39045>.
Read more »
Add new comment
Respond to this visualizations...
Loading...
Click here to view the discussion thread.
Related charts / graphs
Total Green Water
0.00 rating | 1,599 views | 0 comments
Total Green Water
0.00 rating | 1,480 views | 0 comments
Blue Virtual Water Flow in Qatar
0.00 rating | 1,523 views | 0 comments
Green Virtual Water Flow in Qatar
0.00 rating | 1,455 views | 0 comments
You Might Also Like Our Friends' Posts
Copyright 2011 ChartsBin.com. All rights reserved.
About
|
Chat
|
Contact
|
Sign Up
|
Privacy
|
Legal
|
Feedback