This chart shows Chemical Wood Pulp Import Value by Country.
10 years ago
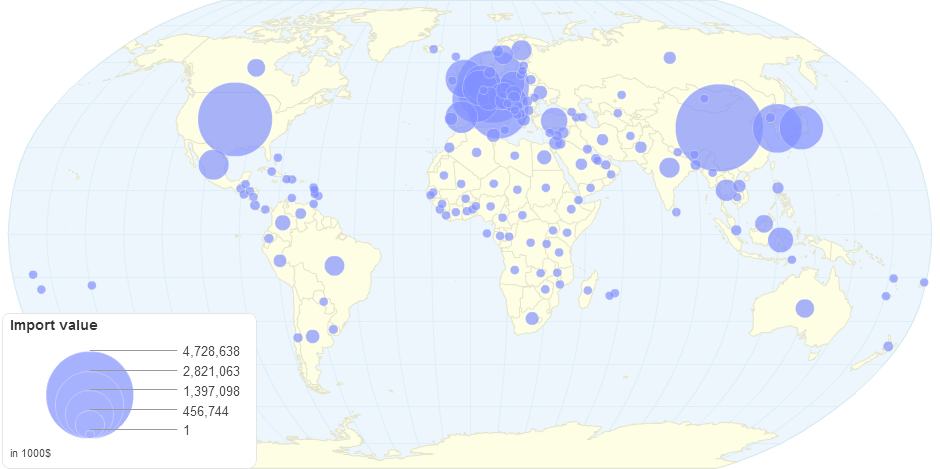
| Country | Value in 1000$ |
|---|---|
| Afghanistan | 44 |
| Albania | 1,018 |
| Algeria | 11,401 |
| Angola | 1,022 |
| Argentina | 69,010 |
| Armenia | 92 |
| Aruba | 13 |
| Australia | 171,575 |
| Austria | 394,662 |
| Azerbaijan | 34 |
| Bahamas | 47 |
| Bahrain | 9,039 |
| Bangladesh | 19,465 |
| Barbados | 52 |
| Belarus | 12,574 |
| Belgium | 732,327 |
| Belize | 642 |
| Benin | 26 |
| Bhutan | 198 |
| Bosnia and Herzegovina | 17,162 |
| Brazil | 201,750 |
| Bulgaria | 10,652 |
| Burkina Faso | 38 |
| Burundi | 48 |
| Cambodia | 28 |
| Cameroon | 347 |
| Canada | 153,198 |
| Central African Republic | 118 |
| Chad | 14 |
| Chile | 8,759 |
| China | 4,728,638 |
| Colombia | 103,225 |
| Congo | 53 |
| Congo, Democratic Republic of | 131 |
| Costa Rica | 13,944 |
| Côte d'Ivoire | 106 |
| Croatia | 346 |
| Cuba | 2,100 |
| Cyprus | 1,058 |
| Czech Republic | 117,730 |
| Denmark | 35,813 |
| Djibouti | 729 |
| Dominica | 7 |
| Dominican Republic | 515 |
| Ecuador | 11,220 |
| Egypt | 82,009 |
| El Salvador | 1,226 |
| Estonia | 118 |
| Ethiopia | 4,153 |
| Faroe Islands | 18 |
| Fiji | 44 |
| Finland | 214,428 |
| France | 1,304,272 |
| French Polynesia | 4 |
| Gabon | 159 |
| Gambia | 3 |
| Georgia | 40 |
| Germany | 3,218,627 |
| Ghana | 248 |
| Greece | 56,046 |
| Guadeloupe | 8 |
| Guatemala | 2,122 |
| Guinea | 3 |
| Haiti | 5 |
| Honduras | 138 |
| Hungary | 60,573 |
| Iceland | 43 |
| India | 209,388 |
| Indonesia | 351,217 |
| Iran, Islamic Republic of | 36,745 |
| Ireland | 1,740 |
| Israel | 61,473 |
| Italy | 2,261,490 |
| Japan | 1,144,045 |
| Jordan | 23,500 |
| Kazakhstan | 682 |
| Kenya | 1,434 |
| Korea, Democratic People's Republic of | 12,859 |
| Korea, Republic of | 1,449,271 |
| Kuwait | 5,900 |
| Latvia | 46 |
| Lebanon | 20,808 |
| Liberia | 9 |
| Libyan Arab Jamahiriya | 1,204 |
| Lithuania | 1,604 |
| Luxembourg | 16 |
| Madagascar | 2 |
| Malawi | 45 |
| Malaysia | 152,865 |
| Mali | 1,100 |
| Malta | 42 |
| Martinique | 83 |
| Mauritania | 1 |
| Mauritius | 834 |
| Mexico | 518,592 |
| Moldova | 1 |
| Mongolia | 7 |
| Montenegro | 16 |
| Morocco | 18,652 |
| Mozambique | 36 |
| Myanmar | 507 |
| Nepal | 34 |
| Netherlands | 782,193 |
| Netherlands Antilles | 4,942 |
| New Caledonia | 763 |
| New Zealand | 15,646 |
| Nicaragua | 131 |
| Niger | 1,171 |
| Nigeria | 769 |
| Niue | 183 |
| Norway | 33,673 |
| Oman | 19 |
| Pakistan | 38,568 |
| Panama | 533 |
| Paraguay | 30 |
| Peru | 59,828 |
| Philippines | 36,129 |
| Poland | 330,350 |
| Portugal | 56,226 |
| Qatar | 300 |
| Réunion | 31 |
| Romania | 19,834 |
| Russian Federation | 52,053 |
| Saint Lucia | 23 |
| Samoa | 66 |
| Sao Tome and Principe | 116 |
| Saudi Arabia | 39,928 |
| Senegal | 208 |
| Serbia | 8,559 |
| Sierra Leone | 880 |
| Singapore | 21,367 |
| Slovakia | 99,840 |
| Slovenia | 143,455 |
| South Africa | 62,777 |
| Spain | 587,692 |
| Sri Lanka | 964 |
| Sudan | 271 |
| Sweden | 191,127 |
| Switzerland | 298,345 |
| Syrian Arab Republic | 34,500 |
| Tanzania | 132 |
| Thailand | 244,842 |
| Macedonia | 2,000 |
| Timor-Leste | 17 |
| Togo | 58 |
| Trinidad and Tobago | 2,379 |
| Tunisia | 66,768 |
| Turkey | 394,877 |
| Uganda | 76 |
| Ukraine | 70,632 |
| United Arab Emirates | 9,083 |
| United Kingdom | 856,664 |
| United States of America | 3,385,711 |
| Uruguay | 7,159 |
| Uzbekistan | 385 |
| Vanuatu | 325 |
| Venezuela | 28,489 |
| Viet Nam | 54,446 |
| Yemen | 56 |
| Zambia | 39 |
| Zimbabwe | 2,988 |
