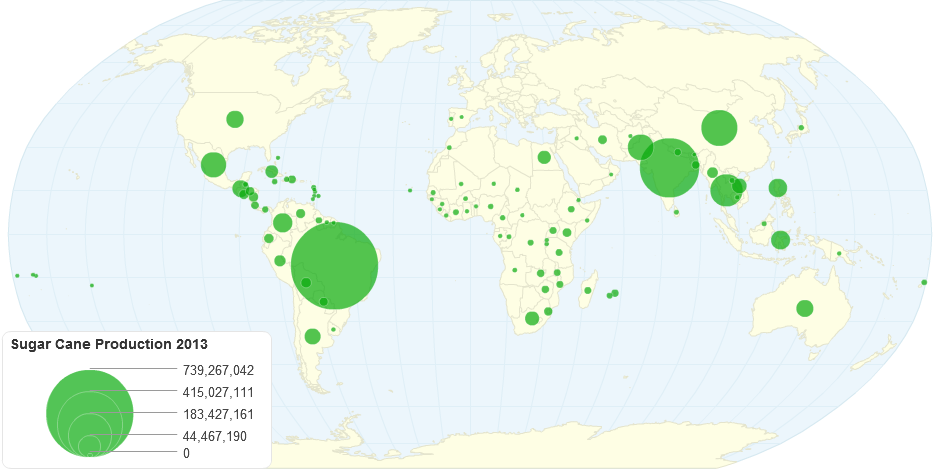
Sugar Cane Production 213
Do you like this chart?
✔ Yes
✖
✚ Share
References and Data Table
HTML Embed code
$ Buy Now
1,746 views
- Add new comment

Annual Sugar Production by Country Metric Tonnes Raw Value
0.00 rating | 3,576 views | 0 comments
Beet versus Cane Sugar Producing Countries
5.00 rating | 3,952 views | 0 comments
Sugar Crop Production 2009
5.00 rating | 2,535 views | 0 comments
Production of Sugar Crops in 2010
5.00 rating | 4,621 views | 0 comments