Register to create your own interactive chart
|
Login »
Search
All
Country info
Drugs & Crime
Environment
Economic
Food & Agriculture
Health
Social
Society
More ▼
Education
Energy
Immigration
Infrastructure
Information & Communication Technology
People
Population
Religion
Sports
Tourism
Work
Others
Get free updates by Email
Get Email Updates!
Report an error
Follow us...
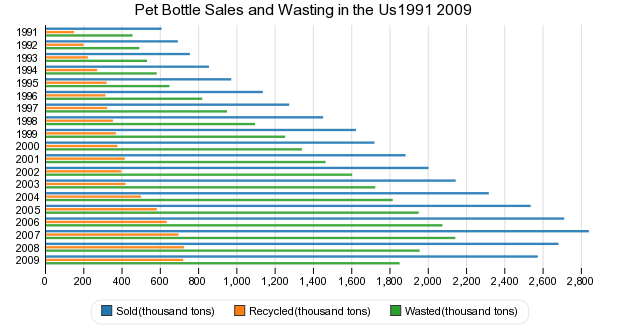
Pet Bottle Sales and Wasting in the Us1991 2009
Hello, you have JavaScript turned off. Please enable JavaScript to see this interactive data visualization.
Do you like this chart?
✔ Yes
✖
✚ Share
References and Data Table
HTML Embed code
$ Buy Now
1,975
views
Tweet
amount of PET bottles produced, wasted, recycled in US
Last updated:
15 years ago
Category:
Environment
Tags:
US
PET bottle
1991-2009
%
References
Embed or download
Source
PET bottle Sales and Wasting in the U.S.,1991-2009
, American Chemistry Council, NAPCOR, viewed 24th November, 2011.
Citation
Pet Bottle Sales and Wasting in the Us1991 2009
, ChartsBin.com, viewed 10th June, 2026, <http://chartsbin.com/view/4049>.
Read more »
Add new comment
Respond to this visualizations...
Loading...
Click here to view the discussion thread.
Related charts / graphs
Carbon Dioxide Emissions in 2009
0.00 rating | 2,085 views | 0 comments
You Might Also Like Our Friends' Posts
Copyright 2011 ChartsBin.com. All rights reserved.
About
|
Chat
|
Contact
|
Sign Up
|
Privacy
|
Legal
|
Feedback