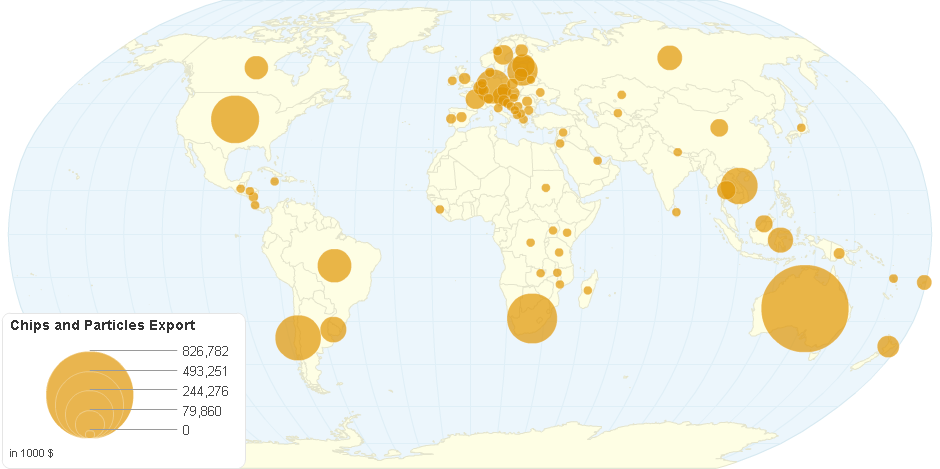
This chart shows Chips and Particles Export Value by Country.
10 years ago

| Country | Value in 1000 $ |
|---|---|
| Afghanistan | 0 |
| Albania | 51 |
| Argentina | 0 |
| Armenia | 0 |
| Australia | 826,782 |
| Austria | 32,521 |
| Azerbaijan | 0 |
| Bangladesh | 0 |
| Belarus | 4 |
| Belgium | 13,371 |
| Bosnia and Herzegovina | 534 |
| Brazil | 116,014 |
| Bulgaria | 1,141 |
| Canada | 52,546 |
| Chile | 218,751 |
| China | 26,628 |
| Congo, Democratic Republic of | 9 |
| Costa Rica | 1 |
| Croatia | 2,029 |
| Cyprus | 0 |
| Czech Republic | 12,060 |
| Denmark | 2,092 |
| Dominican Republic | 0 |
| Estonia | 50,192 |
| Fiji | 16,665 |
| Finland | 9,340 |
| France | 35,135 |
| Germany | 121,374 |
| Greece | 82 |
| Guatemala | 2 |
| Honduras | 82 |
| Hungary | 22 |
| Iceland | 0 |
| India | 0 |
| Indonesia | 63,000 |
| Iran, Islamic Republic of | 0 |
| Ireland | 354 |
| Italy | 363 |
| Jamaica | 8 |
| Japan | 123 |
| Jordan | 2 |
| Kazakhstan | 280 |
| Kenya | 14 |
| Korea, Democratic People's Republic of | 0 |
| Kyrgyzstan | 0 |
| Latvia | 91,969 |
| Lithuania | 11,370 |
| Luxembourg | 5,035 |
| Madagascar | 3 |
| Malawi | 3 |
| Malaysia | 25,000 |
| Malta | 0 |
| Martinique | 0 |
| Mexico | 0 |
| Moldova | 0 |
| Montenegro | 1 |
| Morocco | 0 |
| Mozambique | 10 |
| Myanmar | 0 |
| Nepal | 9 |
| Netherlands | 1,479 |
| New Zealand | 44,447 |
| Nicaragua | 2,064 |
| Nigeria | 0 |
| Norway | 1,528 |
| Oman | 0 |
| Papua New Guinea | 5,623 |
| Paraguay | 0 |
| Poland | 4,388 |
| Portugal | 2,745 |
| Qatar | 31 |
| Romania | 3,155 |
| Russian Federation | 58,600 |
| Saint Vincent and Grenadines | 0 |
| Serbia | 315 |
| Sierra Leone | 1 |
| Singapore | 0 |
| Slovakia | 7,157 |
| Slovenia | 6,158 |
| South Africa | 267,929 |
| Spain | 3,574 |
| Sri Lanka | 16 |
| Sudan | 12 |
| Sweden | 34,966 |
| Switzerland | 2,920 |
| Syrian Arab Republic | 11 |
| Tanzania | 55 |
| Thailand | 29,881 |
| Macedonia | 74 |
| Turkey | 0 |
| Uganda | 3 |
| Ukraine | 514 |
| United Kingdom | 6,539 |
| United States of America | 243,369 |
| Uruguay | 65,394 |
| Uzbekistan | 9 |
| Vanuatu | 624 |
| Venezuela | 0 |
| Viet Nam | 140,000 |
| Zambia | 15 |
| Zimbabwe | 0 |