Register to create your own interactive chart
|
Login »
Search
All
Country info
Drugs & Crime
Environment
Economic
Food & Agriculture
Health
Social
Society
More ▼
Education
Energy
Immigration
Infrastructure
Information & Communication Technology
People
Population
Religion
Sports
Tourism
Work
Others
Get free updates by Email
Get Email Updates!
Report an error
Follow us...
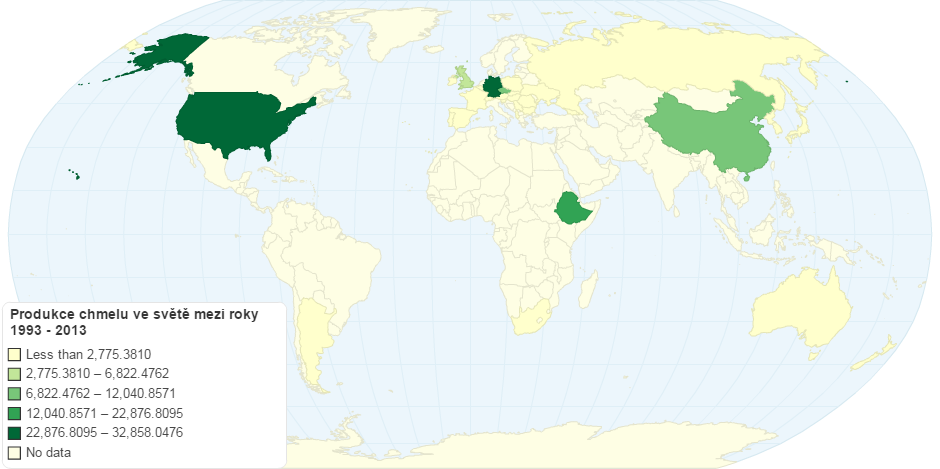
Produkce chmelu ve světě mezi roky 1993 - 2013
Hello, you have JavaScript turned off. Please enable JavaScript to see this interactive data visualization.
Do you like this chart?
✔ Yes
✖
✚ Share
References and Data Table
HTML Embed code
$ Buy Now
1,098
views
Tweet
Map about hops production in the world since 1993 to 2013.
Last updated:
10 years ago
Category:
Food & Agriculture
Tags:
hop
world
References
Embed or download
Source
Produkce chmelu ve světě mezi roky 1993 - 2013
, http://faostat3.fao.org/browse/Q/QC/E, viewed 14th November, 2016.
Citation
Produkce chmelu ve světě mezi roky 1993 - 2013
, ChartsBin.com, viewed 22nd July, 2026, <http://chartsbin.com/view/42692>.
Read more »
Add new comment
Respond to this visualizations...
Loading...
Click here to view the discussion thread.
Related charts / graphs
Dates Consumption By Country
4.04 rating | 13,700 views | 0 comments
Tomato Consumption (tonnes)
4.20 rating | 12,792 views | 1 comments
Tomato Consumption (kg per capita)
4.05 rating | 19,587 views | 0 comments
Tomato Production and Consumption by country.
4.21 rating | 25,709 views | 1 comments
You Might Also Like Our Friends' Posts
Copyright 2011 ChartsBin.com. All rights reserved.
About
|
Chat
|
Contact
|
Sign Up
|
Privacy
|
Legal
|
Feedback