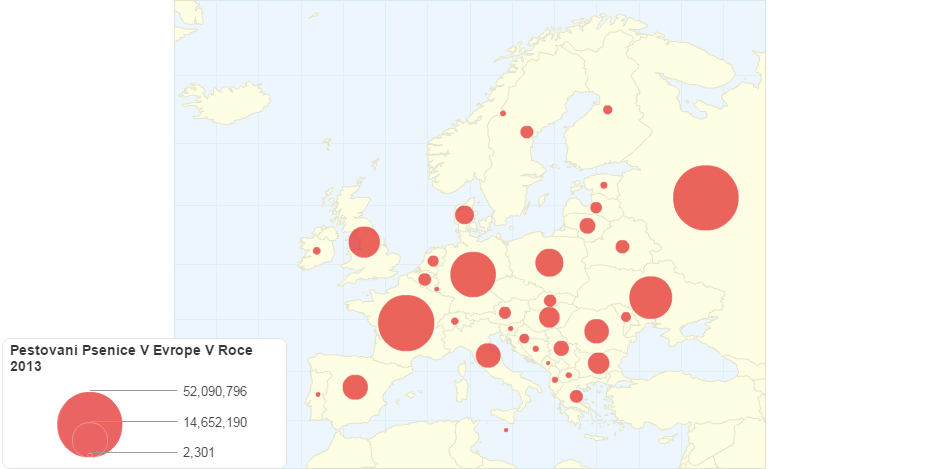
Register to create your own interactive chart
|
Login »
Search
All
Country info
Drugs & Crime
Environment
Economic
Food & Agriculture
Health
Social
Society
More â–¼
Education
Energy
Immigration
Infrastructure
Information & Communication Technology
People
Population
Religion
Sports
Tourism
Work
Others
Get free updates by Email
Get Email Updates!
Report an error
Follow us...
Pěstovánà pšenice v Evropě, v roce 2013
Hello, you have JavaScript turned off. Please enable JavaScript to see this interactive data visualization.
Do you like this chart?
✔ Yes
✖
✚ Share
References and Data Table
HTML Embed code
$ Buy Now
909
views
Tweet
Map of growing wheat in Europe in 2013.
Last updated:
8 years ago
Category:
Food & Agriculture
Tags:
wheat
Europe
2013
References
Embed or download
Source
Pestovani psenice v Evrope v roce 2013
, http://faostat.fao.org, viewed 14th November, 2016.
Citation
Pěstovánà pšenice v Evropě, v roce 2013
, ChartsBin.com, viewed 15th March, 2025, <http://chartsbin.com/view/42743>.
Read more »
Add new comment
Respond to this visualizations...
Loading...
Click here to view the discussion thread.
Related charts / graphs
Množstvà sklizené pšenice v tunách, Evropa
0.00 rating | 540 views | 0 comments
Production of Honey
0.00 rating | 872 views | 0 comments
US All Wheat Planted Acreage % Change
5.00 rating | 3,393 views | 0 comments
Australian First Half Wheat Exports
3.00 rating | 2,775 views | 0 comments
You Might Also Like Our Friends' Posts
Copyright 2011 ChartsBin.com. All rights reserved.
About
|
Chat
|
Contact
|
Sign Up
|
Privacy
|
Legal
|
Feedback