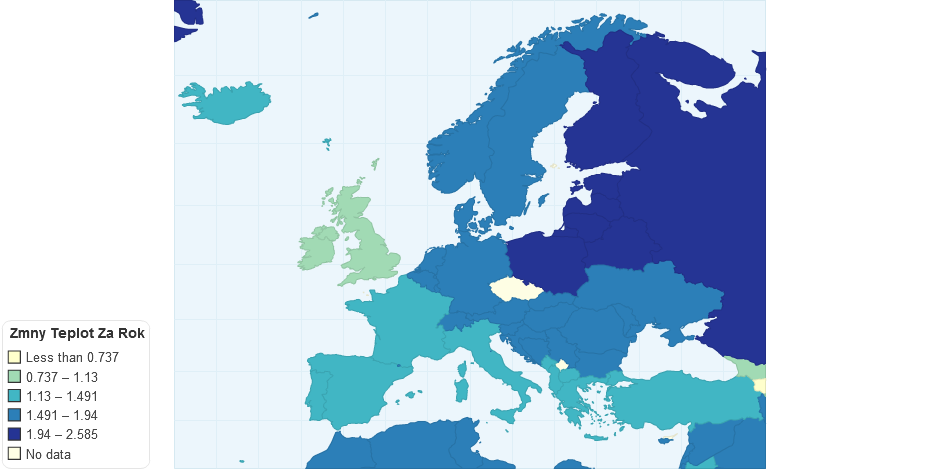
Register to create your own interactive chart
|
Login »
Search
All
Country info
Drugs & Crime
Environment
Economic
Food & Agriculture
Health
Social
Society
More â–¼
Education
Energy
Immigration
Infrastructure
Information & Communication Technology
People
Population
Religion
Sports
Tourism
Work
Others
Get free updates by Email
Get Email Updates!
Report an error
Follow us...
Změny teplot za rok
Hello, you have JavaScript turned off. Please enable JavaScript to see this interactive data visualization.
Do you like this chart?
✔ Yes
✖
✚ Share
References and Data Table
HTML Embed code
$ Buy Now
1,015
views
Tweet
teplota
Last updated:
7 years ago
Category:
Environment
Tags:
teplota
References
Embed or download
Source
změny teplot za rok
, www.fao.org, viewed 9th November, 2017.
Citation
Změny teplot za rok
, ChartsBin.com, viewed 14th March, 2025, <http://chartsbin.com/view/45936>.
Read more »
Add new comment
Respond to this visualizations...
Loading...
Click here to view the discussion thread.
Related charts / graphs
Najnižšia nameraná teplota v štátoch Európy
1.00 rating | 1,072 views | 0 comments
You Might Also Like Our Friends' Posts
Copyright 2011 ChartsBin.com. All rights reserved.
About
|
Chat
|
Contact
|
Sign Up
|
Privacy
|
Legal
|
Feedback