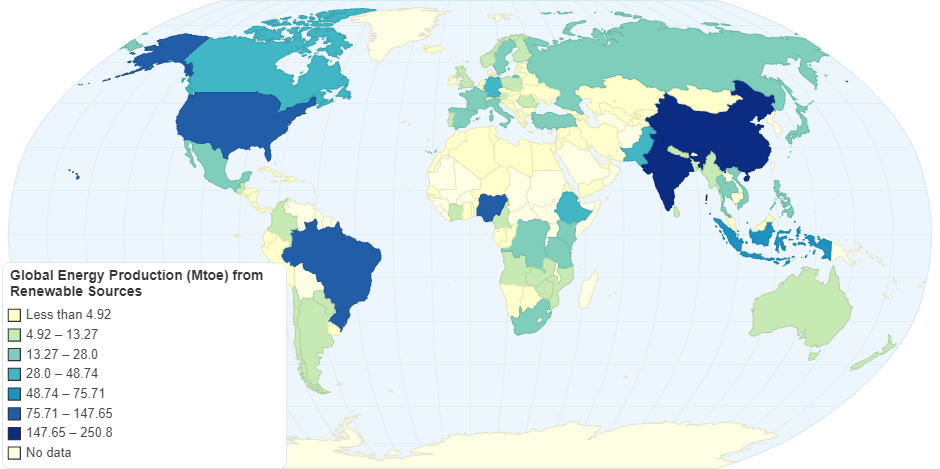
Global Energy Production (Mtoe) from Renewables
Do you like this chart?
✔ Yes
✖
✚ Share
References and Data Table
HTML Embed code
$ Buy Now
1,165 views
- Add new comment

Wind Power Installed in Europe by the End of 2011
5.00 rating | 5,437 views | 0 comments
Us Energy Related Carbon Dioxide Emissions by Fuel ...
0.00 rating | 2,916 views | 0 comments
Us Energy Related Carbon Dioxide Emissions by Fuel ...
0.00 rating | 3,189 views | 0 comments
Reattori Nucleari Nel Mondo (marzo 2011)
5.00 rating | 11,975 views | 0 comments