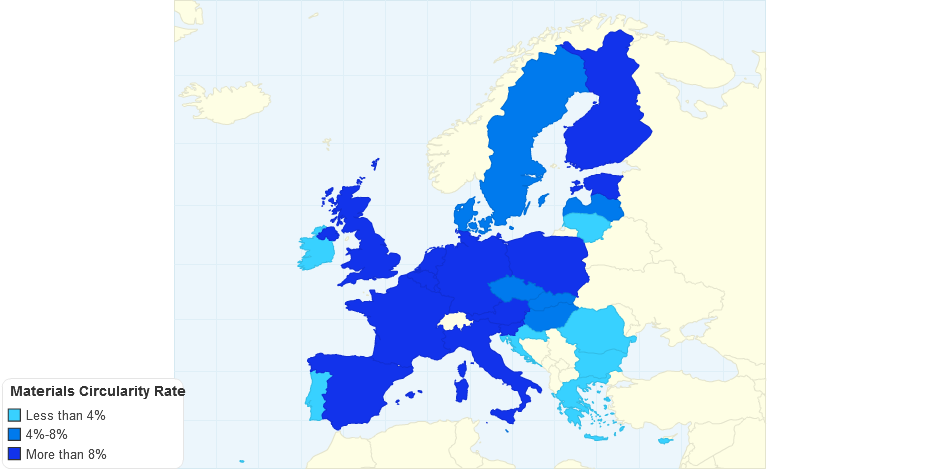
Materials Circularity Rate
Do you like this chart?
✔ Yes
✖
✚ Share
References and Data Table
HTML Embed code
$ Buy Now
996 views
- Add new comment

Global Deaths from Air Pollution
0.00 rating | 1,020 views | 0 comments
Global Deaths from Air Pollution
0.00 rating | 1,011 views | 0 comments
Causes of Death 2017
0.00 rating | 1,099 views | 0 comments
Forest Area Cover of India (as per-centage of gross area)
5.00 rating | 3,059 views | 0 comments