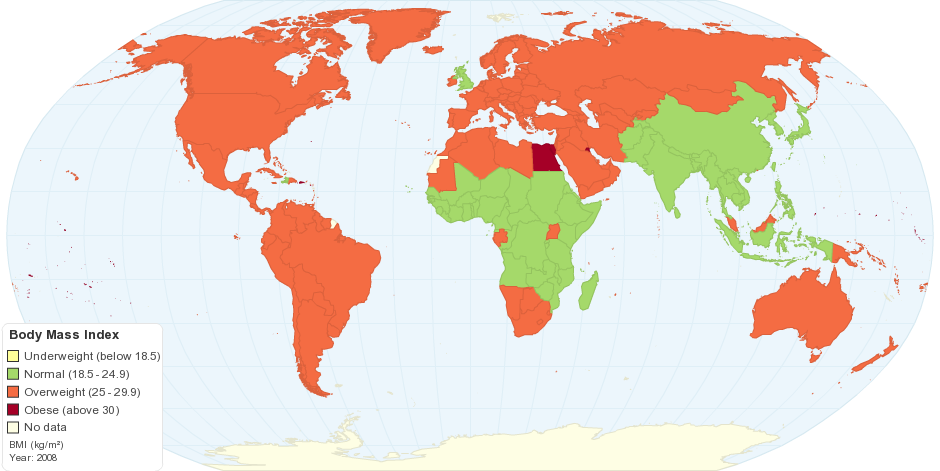
This map shows World trends in age-standardized mean Body Mass Index (BMI) 199 countries over 28 years.
The worldwide prevalence of obesity has nearly doubled since 1980, according to a project that tracked risk factors for heart disease and stroke. The study, published on February 2011 assess how body mass index (BMI) changed between 1980 and 2008.
Key findings
- In 2008, women in the world were obese (with a BMI above 30 kg/m2), compared to women in 1980.
- Pacific island nations have the highest average BMI in the world, reaching 34-35 kg/m2.
- Among high income countries, USA has the single highest BMI (over 28 kg/m2 for men and women). Japan has the lowest BMI (about 22 kg/m2 for women and 24 kg/m2 for men).
- Among high-income countries, between 1980 and 2008, BMI rose most in USA (by more than 1 kg/m2/decade), followed by New Zealand and Australia for women and followed by UK and Australia for men.
- Women in a few Western European countries had virtually no rise in BMI (last 28 years).
Please follow reference link below for more information.
DataSource: The Global Burden of Metabolic Risk Factors of Chronic Diseases Collaborating Group is a worldwide network of clinical and public health researchers and practitioners that has collated a unique dataset on these risk factors from different countries, and has developed and applied advanced statistical methods for estimating national, regional, and global trends. This work has been on body mass index (BMI).
15 years ago

