Register to create your own interactive chart
|
Login »
Search
All
Country info
Drugs & Crime
Environment
Economic
Food & Agriculture
Health
Social
Society
More ▼
Education
Energy
Immigration
Infrastructure
Information & Communication Technology
People
Population
Religion
Sports
Tourism
Work
Others
Get free updates by Email
Get Email Updates!
Report an error
Follow us...
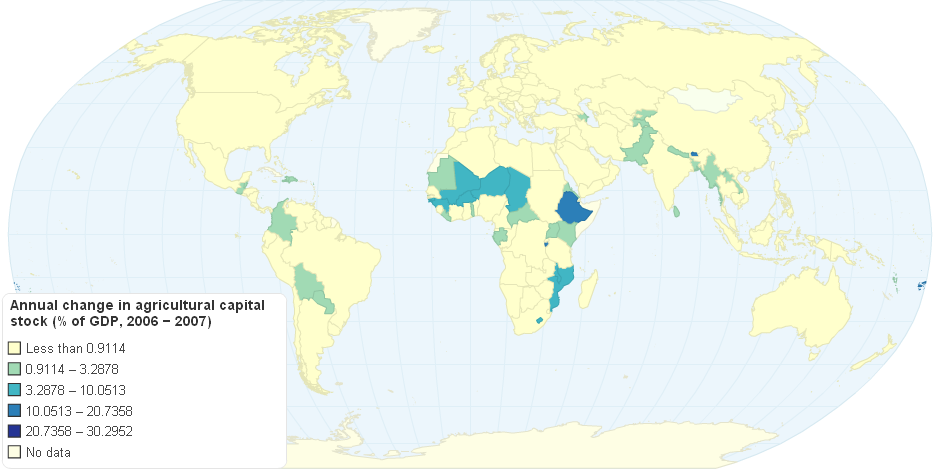
Annual change in agricultural capital stock
Hello, you have JavaScript turned off. Please enable JavaScript to see this interactive data visualization.
Do you like this chart?
✔ Yes
✖
✚ Share
References and Data Table
HTML Embed code
$ Buy Now
78,428
views
Tweet
Annual change in agricultural capital stock (% of GDP)
Last updated:
14 years ago
Category:
Food & Agriculture
Tags:
capital stock in agriculture
References
Embed or download
Source
Capital and investment
, FAO, viewed 19th June, 2012.
Citation
Annual change in agricultural capital stock
, ChartsBin.com, viewed 22nd July, 2026, <http://chartsbin.com/view/6783>.
Read more »
Add new comment
Respond to this visualizations...
Loading...
Click here to view the discussion thread.
Related charts / graphs
Agricultural Capital Stock
5.00 rating | 2,044 views | 0 comments
Agricultural Capital Stock Per Worker
5.00 rating | 2,235 views | 0 comments
World Organic Farm Land Data 2005 2009 Ifoam FiBL Survey
5.00 rating | 7,010 views | 0 comments
Organic Agriculture Area Worldwide, 2009. IFOAM-FiBL Survey
5.00 rating | 6,073 views | 2 comments
You Might Also Like Our Friends' Posts
Copyright 2011 ChartsBin.com. All rights reserved.
About
|
Chat
|
Contact
|
Sign Up
|
Privacy
|
Legal
|
Feedback