Register to create your own interactive chart
|
Login »
Search
All
Country info
Drugs & Crime
Environment
Economic
Food & Agriculture
Health
Social
Society
More ▼
Education
Energy
Immigration
Infrastructure
Information & Communication Technology
People
Population
Religion
Sports
Tourism
Work
Others
Get free updates by Email
Get Email Updates!
Report an error
Follow us...
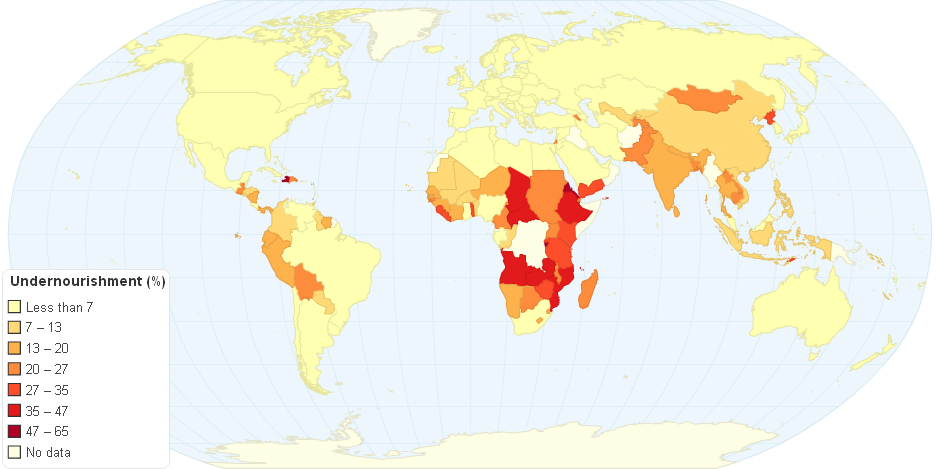
Undernourishment (percent)
Hello, you have JavaScript turned off. Please enable JavaScript to see this interactive data visualization.
Do you like this chart?
✔ Yes
✖
✚ Share
References and Data Table
HTML Embed code
$ Buy Now
2,492
views
Tweet
Undernourishment, expressed as percent of population, 2006-08. FAO data
Last updated:
14 years ago
Category:
Food & Agriculture
Tags:
undernourishment
health
relative
2006-2008
References
Embed or download
Source
Global undernourishment
, FAO Statistics Division, viewed 3rd July, 2012.
Citation
Undernourishment (percent)
, ChartsBin.com, viewed 15th July, 2026, <http://chartsbin.com/view/7007>.
Read more »
Add new comment
Respond to this visualizations...
Loading...
Click here to view the discussion thread.
Related charts / graphs
Global Undernourishment
5.00 rating | 3,775 views | 0 comments
Undernourishment (absolute figures)
0.00 rating | 2,273 views | 0 comments
Percentage Population Undernourished 2012 14
3.00 rating | 4,117 views | 0 comments
Total Production of Exporting Countries 2006
0.00 rating | 2,020 views | 0 comments
You Might Also Like Our Friends' Posts
Copyright 2011 ChartsBin.com. All rights reserved.
About
|
Chat
|
Contact
|
Sign Up
|
Privacy
|
Legal
|
Feedback